Immigrants from Fiji vs Nicaraguan Seniors Poverty Over the Age of 75
COMPARE
Immigrants from Fiji
Nicaraguan
Seniors Poverty Over the Age of 75
Seniors Poverty Over the Age of 75 Comparison
Immigrants from Fiji
Nicaraguans
12.2%
SENIORS POVERTY OVER THE AGE OF 75
51.5/ 100
METRIC RATING
172nd/ 347
METRIC RANK
16.6%
SENIORS POVERTY OVER THE AGE OF 75
0.0/ 100
METRIC RATING
325th/ 347
METRIC RANK
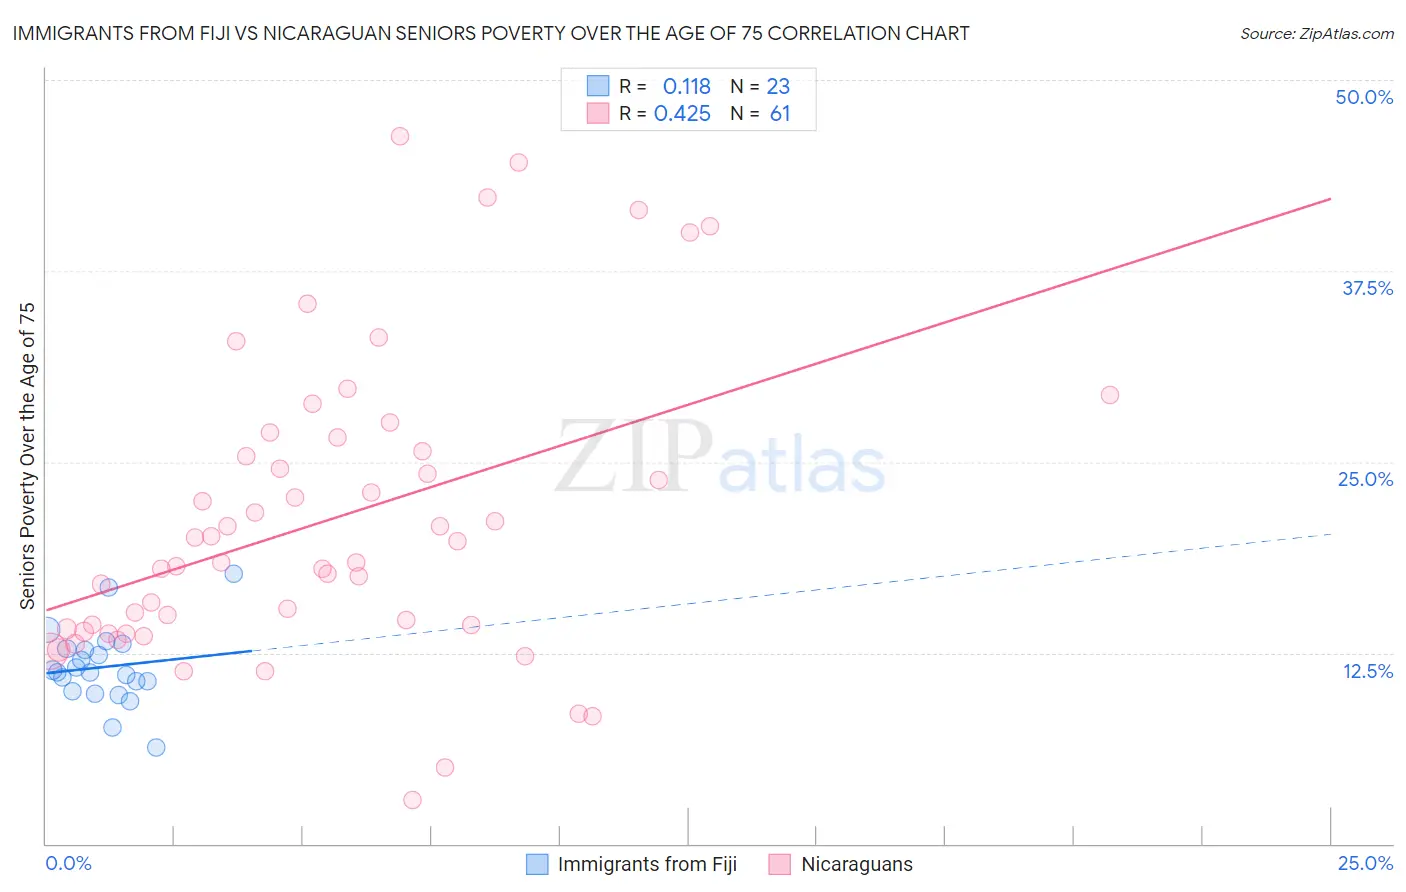
Immigrants from Fiji vs Nicaraguan Seniors Poverty Over the Age of 75 Correlation Chart
The statistical analysis conducted on geographies consisting of 93,526,881 people shows a poor positive correlation between the proportion of Immigrants from Fiji and poverty level among seniors over the age of 75 in the United States with a correlation coefficient (R) of 0.118 and weighted average of 12.2%. Similarly, the statistical analysis conducted on geographies consisting of 283,995,747 people shows a moderate positive correlation between the proportion of Nicaraguans and poverty level among seniors over the age of 75 in the United States with a correlation coefficient (R) of 0.425 and weighted average of 16.6%, a difference of 36.4%.
Seniors Poverty Over the Age of 75 Correlation Summary
| Measurement | Immigrants from Fiji | Nicaraguan |
| Minimum | 6.3% | 2.9% |
| Maximum | 17.7% | 46.3% |
| Range | 11.4% | 43.4% |
| Mean | 11.6% | 21.1% |
| Median | 11.2% | 18.4% |
| Interquartile 25% (IQ1) | 10.0% | 14.0% |
| Interquartile 75% (IQ3) | 12.8% | 26.2% |
| Interquartile Range (IQR) | 2.8% | 12.2% |
| Standard Deviation (Sample) | 2.5% | 9.8% |
| Standard Deviation (Population) | 2.5% | 9.7% |
Similar Demographics by Seniors Poverty Over the Age of 75
Demographics Similar to Immigrants from Fiji by Seniors Poverty Over the Age of 75
In terms of seniors poverty over the age of 75, the demographic groups most similar to Immigrants from Fiji are Spaniard (12.2%, a difference of 0.010%), Immigrants from Thailand (12.2%, a difference of 0.040%), Arab (12.2%, a difference of 0.080%), Immigrants from Europe (12.2%, a difference of 0.12%), and Immigrants from Saudi Arabia (12.2%, a difference of 0.17%).
| Demographics | Rating | Rank | Seniors Poverty Over the Age of 75 |
| Okinawans | 56.3 /100 | #165 | Average 12.1% |
| Egyptians | 54.8 /100 | #166 | Average 12.1% |
| Immigrants | Switzerland | 54.5 /100 | #167 | Average 12.1% |
| Immigrants | Syria | 53.9 /100 | #168 | Average 12.2% |
| Immigrants | Egypt | 53.7 /100 | #169 | Average 12.2% |
| Immigrants | Thailand | 52.0 /100 | #170 | Average 12.2% |
| Spaniards | 51.6 /100 | #171 | Average 12.2% |
| Immigrants | Fiji | 51.5 /100 | #172 | Average 12.2% |
| Arabs | 50.5 /100 | #173 | Average 12.2% |
| Immigrants | Europe | 50.0 /100 | #174 | Average 12.2% |
| Immigrants | Saudi Arabia | 49.5 /100 | #175 | Average 12.2% |
| Immigrants | Iran | 48.1 /100 | #176 | Average 12.2% |
| Immigrants | Asia | 47.8 /100 | #177 | Average 12.2% |
| Immigrants | Nonimmigrants | 46.8 /100 | #178 | Average 12.2% |
| Mongolians | 45.5 /100 | #179 | Average 12.2% |
Demographics Similar to Nicaraguans by Seniors Poverty Over the Age of 75
In terms of seniors poverty over the age of 75, the demographic groups most similar to Nicaraguans are Immigrants from Uzbekistan (16.5%, a difference of 0.38%), Central American Indian (16.5%, a difference of 0.43%), Immigrants from Barbados (16.5%, a difference of 0.52%), Immigrants from Haiti (16.5%, a difference of 0.55%), and Pueblo (16.7%, a difference of 0.70%).
| Demographics | Rating | Rank | Seniors Poverty Over the Age of 75 |
| Houma | 0.0 /100 | #318 | Tragic 16.2% |
| Haitians | 0.0 /100 | #319 | Tragic 16.2% |
| Immigrants | Yemen | 0.0 /100 | #320 | Tragic 16.5% |
| Immigrants | Haiti | 0.0 /100 | #321 | Tragic 16.5% |
| Immigrants | Barbados | 0.0 /100 | #322 | Tragic 16.5% |
| Central American Indians | 0.0 /100 | #323 | Tragic 16.5% |
| Immigrants | Uzbekistan | 0.0 /100 | #324 | Tragic 16.5% |
| Nicaraguans | 0.0 /100 | #325 | Tragic 16.6% |
| Pueblo | 0.0 /100 | #326 | Tragic 16.7% |
| Sioux | 0.0 /100 | #327 | Tragic 16.8% |
| Cape Verdeans | 0.0 /100 | #328 | Tragic 16.8% |
| Immigrants | Dominica | 0.0 /100 | #329 | Tragic 17.0% |
| British West Indians | 0.0 /100 | #330 | Tragic 17.4% |
| Immigrants | Armenia | 0.0 /100 | #331 | Tragic 17.5% |
| Immigrants | St. Vincent and the Grenadines | 0.0 /100 | #332 | Tragic 17.5% |