Immigrants from Turkey vs Arab Seniors Poverty Over the Age of 75
COMPARE
Immigrants from Turkey
Arab
Seniors Poverty Over the Age of 75
Seniors Poverty Over the Age of 75 Comparison
Immigrants from Turkey
Arabs
12.0%
SENIORS POVERTY OVER THE AGE OF 75
64.7/ 100
METRIC RATING
153rd/ 347
METRIC RANK
12.2%
SENIORS POVERTY OVER THE AGE OF 75
50.5/ 100
METRIC RATING
173rd/ 347
METRIC RANK
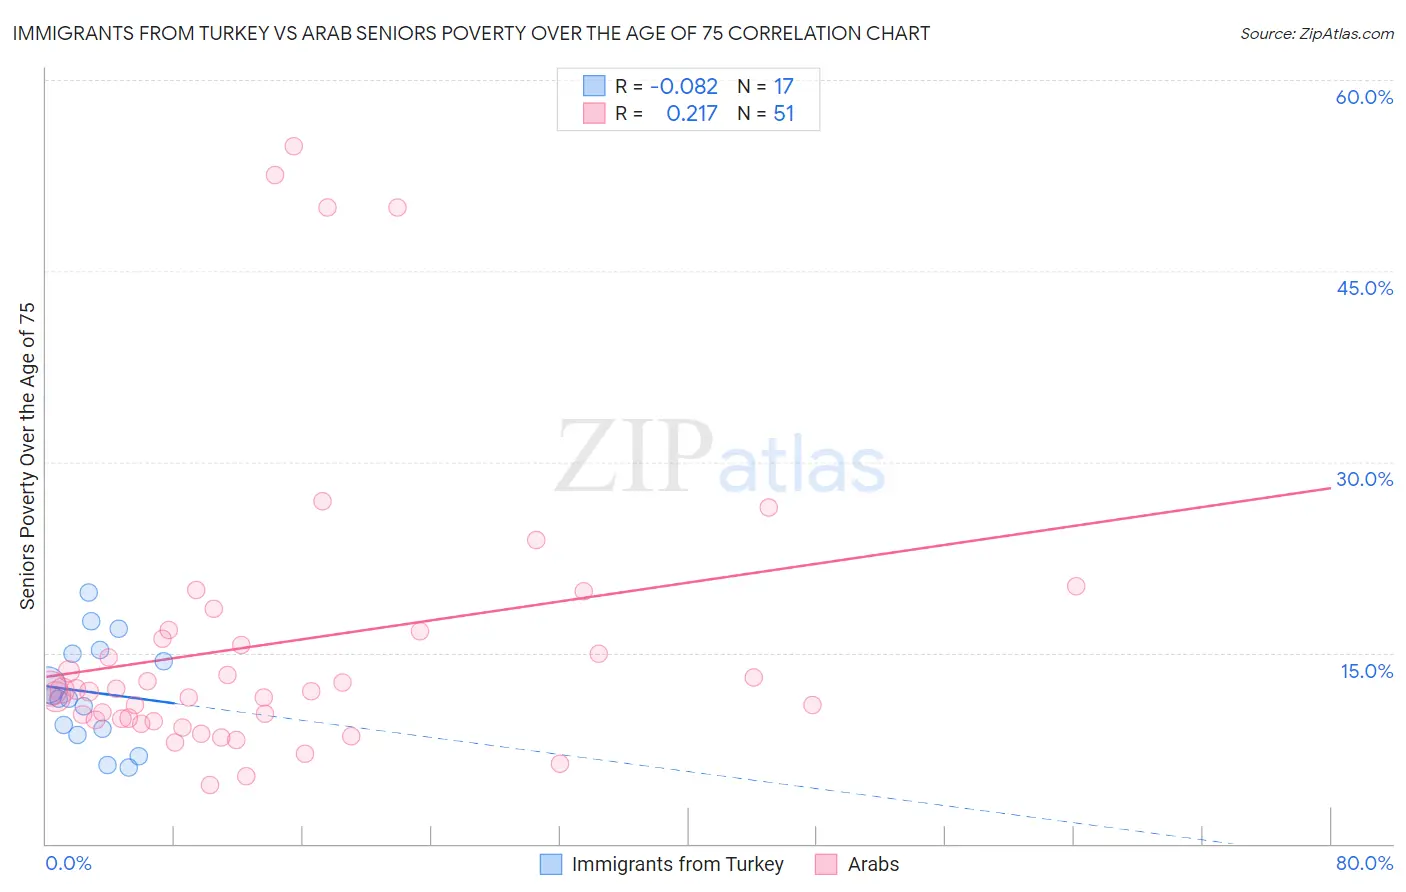
Immigrants from Turkey vs Arab Seniors Poverty Over the Age of 75 Correlation Chart
The statistical analysis conducted on geographies consisting of 221,368,825 people shows a slight negative correlation between the proportion of Immigrants from Turkey and poverty level among seniors over the age of 75 in the United States with a correlation coefficient (R) of -0.082 and weighted average of 12.0%. Similarly, the statistical analysis conducted on geographies consisting of 478,995,292 people shows a weak positive correlation between the proportion of Arabs and poverty level among seniors over the age of 75 in the United States with a correlation coefficient (R) of 0.217 and weighted average of 12.2%, a difference of 1.2%.
Seniors Poverty Over the Age of 75 Correlation Summary
| Measurement | Immigrants from Turkey | Arab |
| Minimum | 6.0% | 4.6% |
| Maximum | 19.8% | 54.8% |
| Range | 13.8% | 50.2% |
| Mean | 11.9% | 15.8% |
| Median | 11.4% | 12.0% |
| Interquartile 25% (IQ1) | 8.8% | 9.7% |
| Interquartile 75% (IQ3) | 15.1% | 16.7% |
| Interquartile Range (IQR) | 6.3% | 6.9% |
| Standard Deviation (Sample) | 4.1% | 11.7% |
| Standard Deviation (Population) | 3.9% | 11.6% |
Demographics Similar to Immigrants from Turkey and Arabs by Seniors Poverty Over the Age of 75
In terms of seniors poverty over the age of 75, the demographic groups most similar to Immigrants from Turkey are Cambodian (12.0%, a difference of 0.060%), Indonesian (12.1%, a difference of 0.18%), Immigrants from Burma/Myanmar (12.1%, a difference of 0.21%), Immigrants from Sudan (12.1%, a difference of 0.27%), and Portuguese (12.1%, a difference of 0.30%). Similarly, the demographic groups most similar to Arabs are Immigrants from Fiji (12.2%, a difference of 0.080%), Spaniard (12.2%, a difference of 0.090%), Immigrants from Thailand (12.2%, a difference of 0.13%), Immigrants from Egypt (12.2%, a difference of 0.27%), and Immigrants from Syria (12.2%, a difference of 0.28%).
| Demographics | Rating | Rank | Seniors Poverty Over the Age of 75 |
| Immigrants | Turkey | 64.7 /100 | #153 | Good 12.0% |
| Cambodians | 64.0 /100 | #154 | Good 12.0% |
| Indonesians | 62.6 /100 | #155 | Good 12.1% |
| Immigrants | Burma/Myanmar | 62.3 /100 | #156 | Good 12.1% |
| Immigrants | Sudan | 61.7 /100 | #157 | Good 12.1% |
| Portuguese | 61.3 /100 | #158 | Good 12.1% |
| Immigrants | Middle Africa | 61.2 /100 | #159 | Good 12.1% |
| Immigrants | Eastern Africa | 60.9 /100 | #160 | Good 12.1% |
| Immigrants | Norway | 60.6 /100 | #161 | Good 12.1% |
| Immigrants | Serbia | 60.2 /100 | #162 | Good 12.1% |
| Immigrants | Greece | 58.2 /100 | #163 | Average 12.1% |
| Potawatomi | 57.4 /100 | #164 | Average 12.1% |
| Okinawans | 56.3 /100 | #165 | Average 12.1% |
| Egyptians | 54.8 /100 | #166 | Average 12.1% |
| Immigrants | Switzerland | 54.5 /100 | #167 | Average 12.1% |
| Immigrants | Syria | 53.9 /100 | #168 | Average 12.2% |
| Immigrants | Egypt | 53.7 /100 | #169 | Average 12.2% |
| Immigrants | Thailand | 52.0 /100 | #170 | Average 12.2% |
| Spaniards | 51.6 /100 | #171 | Average 12.2% |
| Immigrants | Fiji | 51.5 /100 | #172 | Average 12.2% |
| Arabs | 50.5 /100 | #173 | Average 12.2% |