Immigrants from Ethiopia vs Bangladeshi Seniors Poverty Over the Age of 75
COMPARE
Immigrants from Ethiopia
Bangladeshi
Seniors Poverty Over the Age of 75
Seniors Poverty Over the Age of 75 Comparison
Immigrants from Ethiopia
Bangladeshis
11.6%
SENIORS POVERTY OVER THE AGE OF 75
91.7/ 100
METRIC RATING
99th/ 347
METRIC RANK
12.0%
SENIORS POVERTY OVER THE AGE OF 75
70.4/ 100
METRIC RATING
146th/ 347
METRIC RANK
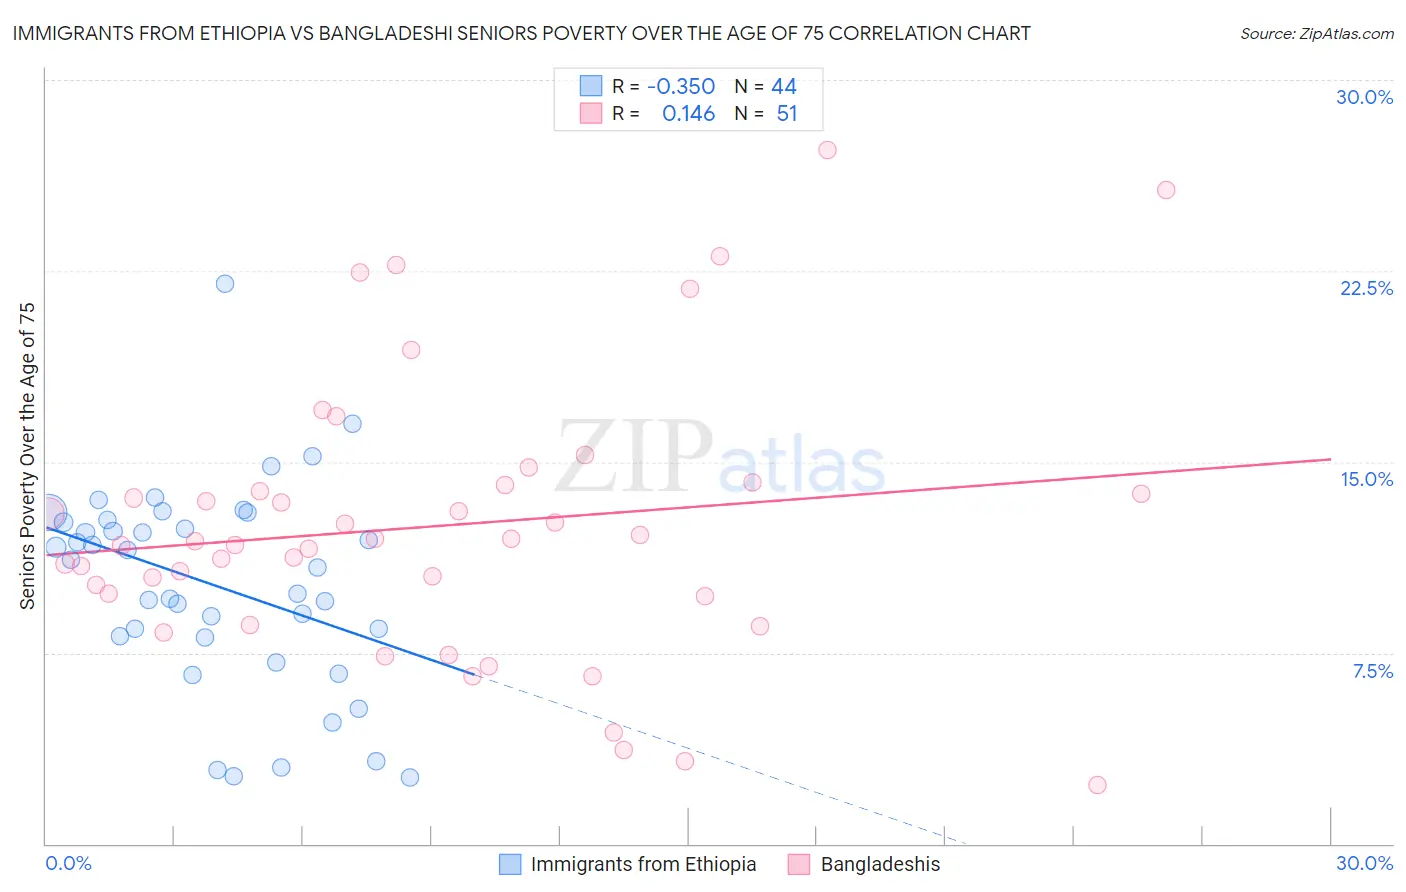
Immigrants from Ethiopia vs Bangladeshi Seniors Poverty Over the Age of 75 Correlation Chart
The statistical analysis conducted on geographies consisting of 210,209,195 people shows a mild negative correlation between the proportion of Immigrants from Ethiopia and poverty level among seniors over the age of 75 in the United States with a correlation coefficient (R) of -0.350 and weighted average of 11.6%. Similarly, the statistical analysis conducted on geographies consisting of 140,437,796 people shows a poor positive correlation between the proportion of Bangladeshis and poverty level among seniors over the age of 75 in the United States with a correlation coefficient (R) of 0.146 and weighted average of 12.0%, a difference of 3.3%.
Seniors Poverty Over the Age of 75 Correlation Summary
| Measurement | Immigrants from Ethiopia | Bangladeshi |
| Minimum | 2.6% | 2.3% |
| Maximum | 22.0% | 27.3% |
| Range | 19.4% | 24.9% |
| Mean | 10.2% | 12.5% |
| Median | 11.0% | 11.9% |
| Interquartile 25% (IQ1) | 8.1% | 9.7% |
| Interquartile 75% (IQ3) | 12.7% | 14.1% |
| Interquartile Range (IQR) | 4.5% | 4.3% |
| Standard Deviation (Sample) | 4.0% | 5.4% |
| Standard Deviation (Population) | 4.0% | 5.4% |
Similar Demographics by Seniors Poverty Over the Age of 75
Demographics Similar to Immigrants from Ethiopia by Seniors Poverty Over the Age of 75
In terms of seniors poverty over the age of 75, the demographic groups most similar to Immigrants from Ethiopia are Immigrants from Japan (11.6%, a difference of 0.070%), Syrian (11.6%, a difference of 0.16%), Romanian (11.6%, a difference of 0.18%), Jordanian (11.6%, a difference of 0.24%), and Immigrants from Bosnia and Herzegovina (11.6%, a difference of 0.27%).
| Demographics | Rating | Rank | Seniors Poverty Over the Age of 75 |
| Kenyans | 93.9 /100 | #92 | Exceptional 11.5% |
| Immigrants | Poland | 92.9 /100 | #93 | Exceptional 11.6% |
| Creek | 92.7 /100 | #94 | Exceptional 11.6% |
| Immigrants | Bosnia and Herzegovina | 92.6 /100 | #95 | Exceptional 11.6% |
| Immigrants | Sweden | 92.6 /100 | #96 | Exceptional 11.6% |
| Romanians | 92.3 /100 | #97 | Exceptional 11.6% |
| Immigrants | Japan | 91.9 /100 | #98 | Exceptional 11.6% |
| Immigrants | Ethiopia | 91.7 /100 | #99 | Exceptional 11.6% |
| Syrians | 91.1 /100 | #100 | Exceptional 11.6% |
| Jordanians | 90.8 /100 | #101 | Exceptional 11.6% |
| Guamanians/Chamorros | 90.6 /100 | #102 | Exceptional 11.6% |
| Immigrants | Kuwait | 90.5 /100 | #103 | Exceptional 11.6% |
| Immigrants | Singapore | 90.3 /100 | #104 | Exceptional 11.6% |
| Chickasaw | 90.2 /100 | #105 | Exceptional 11.6% |
| Russians | 89.9 /100 | #106 | Excellent 11.6% |
Demographics Similar to Bangladeshis by Seniors Poverty Over the Age of 75
In terms of seniors poverty over the age of 75, the demographic groups most similar to Bangladeshis are Hmong (12.0%, a difference of 0.050%), Immigrants from Belgium (12.0%, a difference of 0.050%), American (12.0%, a difference of 0.060%), Immigrants from Laos (12.0%, a difference of 0.11%), and Immigrants from Latvia (12.0%, a difference of 0.12%).
| Demographics | Rating | Rank | Seniors Poverty Over the Age of 75 |
| Immigrants | Kenya | 72.6 /100 | #139 | Good 11.9% |
| Immigrants | Pakistan | 71.9 /100 | #140 | Good 12.0% |
| Immigrants | Cameroon | 71.7 /100 | #141 | Good 12.0% |
| Immigrants | Laos | 71.5 /100 | #142 | Good 12.0% |
| Americans | 71.0 /100 | #143 | Good 12.0% |
| Hmong | 70.8 /100 | #144 | Good 12.0% |
| Immigrants | Belgium | 70.8 /100 | #145 | Good 12.0% |
| Bangladeshis | 70.4 /100 | #146 | Good 12.0% |
| Immigrants | Latvia | 69.1 /100 | #147 | Good 12.0% |
| Immigrants | Zaire | 67.6 /100 | #148 | Good 12.0% |
| Asians | 67.4 /100 | #149 | Good 12.0% |
| Cypriots | 67.3 /100 | #150 | Good 12.0% |
| Cherokee | 65.8 /100 | #151 | Good 12.0% |
| Immigrants | Korea | 65.5 /100 | #152 | Good 12.0% |
| Immigrants | Turkey | 64.7 /100 | #153 | Good 12.0% |