Immigrants from Southern Europe vs Bangladeshi Seniors Poverty Over the Age of 75

COMPARE

Immigrants from Southern Europe
Race
Ancestry
AfghanAfricanAlaska NativeAlaskan AthabascanAlbanianAleutAlsatianAmericanApacheArabArapahoArgentineanArmenianAssyrian/Chaldean/SyriacAustralianAustrianBahamianBarbadianBasqueBelgianBelizeanBermudanBhutaneseBlackfeetBolivianBrazilianBritishBritish West IndianBulgarianBurmeseCajunCambodianCanadianCape VerdeanCarpatho RusynCelticCentral AmericanCentral American IndianCherokeeCheyenneChickasawChileanChineseChippewaChoctawColombianColvilleComancheCosta RicanCreeCreekCroatianCrowCubanCypriotCzechCzechoslovakianDanishDelawareDominicanDutchDutch West IndianEastern EuropeanEcuadorianEgyptianEnglishEstonianEthiopianEuropeanFijianFilipinoFinnishFrenchFrench American IndianFrench CanadianGermanGerman RussianGhanaianGreekGuamanian/ChamorroGuatemalanGuyaneseHaitianHmongHonduranHopiHoumaHungarianIcelanderIndian (Asian)IndonesianInupiatIranianIraqiIrishIroquoisIsraeliItalianJamaicanJapaneseJordanianKenyanKiowaKoreanLaotianLatvianLebaneseLiberianLithuanianLumbeeLuxembourgerMacedonianMalaysianMalteseMarshalleseMenomineeMexicanMexican American IndianMongolianMoroccanNative HawaiianNavajoNepaleseNew ZealanderNicaraguanNigerianNorthern EuropeanNorwegianOkinawanOsageOttawaPaiutePakistaniPalestinianPanamanianParaguayanPennsylvania GermanPeruvianPimaPolishPortuguesePotawatomiPuebloPuerto RicanPuget Sound SalishRomanianRussianSalvadoranSamoanScandinavianScotch-IrishScottishSeminoleSenegaleseSerbianShoshoneSierra LeoneanSiouxSlavicSlovakSloveneSomaliSouth AfricanSouth AmericanSouth American IndianSoviet UnionSpaniardSpanishSpanish AmericanSpanish American IndianSri LankanSubsaharan AfricanSudaneseSwedishSwissSyrianTaiwaneseThaiTlingit-HaidaTohono O'OdhamTonganTrinidadian and TobagonianTsimshianTurkishU.S. Virgin IslanderUgandanUkrainianUruguayanUteVenezuelanVietnameseWelshWest IndianYakamaYaquiYugoslavianYumanYup'ikZimbabwean
Immigration
NonimmigrantsImmigrantsAfghanistanAfricaAlbaniaArgentinaArmeniaAsiaAustraliaAustriaBahamasBangladeshBarbadosBelarusBelgiumBelizeBoliviaBosnia and HerzegovinaBrazilBulgariaBurma/MyanmarCabo VerdeCambodiaCameroonCanadaCaribbeanCentral AmericaChileChinaColombiaCongoCosta RicaCroatiaCubaCzechoslovakiaDenmarkDominicaDominican RepublicEastern AfricaEastern AsiaEastern EuropeEcuadorEgyptEl SalvadorEnglandEritreaEthiopiaEuropeFijiFranceGermanyGhanaGreeceGrenadaGuatemalaGuyanaHaitiHondurasHong KongHungaryIndiaIndonesiaIranIraqIrelandIsraelItalyJamaicaJapanJordanKazakhstanKenyaKoreaKuwaitLaosLatin AmericaLatviaLebanonLiberiaLithuaniaMalaysiaMexicoMicronesiaMiddle AfricaMoldovaMoroccoNepalNetherlandsNicaraguaNigeriaNorth AmericaNorth MacedoniaNorthern AfricaNorthern EuropeNorwayOceaniaPakistanPanamaPeruPhilippinesPolandPortugalRomaniaRussiaSaudi ArabiaScotlandSenegalSerbiaSierra LeoneSingaporeSomaliaSouth AfricaSouth AmericaSouth Central AsiaSouth Eastern AsiaSouthern EuropeSpainSri LankaSt. Vincent and the GrenadinesSudanSwedenSwitzerlandSyriaTaiwanThailandTrinidad and TobagoTurkeyUgandaUkraineUruguayUzbekistanVenezuelaVietnamWest IndiesWestern AfricaWestern AsiaWestern EuropeYemenZaireZimbabweAzores
Bangladeshi
Race
Ancestry
AfghanAfricanAlaska NativeAlaskan AthabascanAlbanianAleutAlsatianAmericanApacheArabArapahoArgentineanArmenianAssyrian/Chaldean/SyriacAustralianAustrianBahamianBangladeshiBarbadianBasqueBelgianBelizeanBermudanBhutaneseBlackfeetBolivianBrazilianBritishBritish West IndianBulgarianBurmeseCajunCambodianCanadianCape VerdeanCarpatho RusynCelticCentral AmericanCentral American IndianCherokeeCheyenneChickasawChileanChineseChippewaChoctawColombianColvilleComancheCosta RicanCreeCreekCroatianCrowCubanCypriotCzechCzechoslovakianDanishDelawareDominicanDutchDutch West IndianEastern EuropeanEcuadorianEgyptianEnglishEstonianEthiopianEuropeanFijianFilipinoFinnishFrenchFrench American IndianFrench CanadianGermanGerman RussianGhanaianGreekGuamanian/ChamorroGuatemalanGuyaneseHaitianHmongHonduranHopiHoumaHungarianIcelanderIndian (Asian)IndonesianInupiatIranianIraqiIrishIroquoisIsraeliItalianJamaicanJapaneseJordanianKenyanKiowaKoreanLaotianLatvianLebaneseLiberianLithuanianLumbeeLuxembourgerMacedonianMalaysianMalteseMarshalleseMenomineeMexicanMexican American IndianMongolianMoroccanNative HawaiianNavajoNepaleseNew ZealanderNicaraguanNigerianNorthern EuropeanNorwegianOkinawanOsageOttawaPaiutePakistaniPalestinianPanamanianParaguayanPennsylvania GermanPeruvianPimaPolishPortuguesePotawatomiPuebloPuerto RicanPuget Sound SalishRomanianRussianSalvadoranSamoanScandinavianScotch-IrishScottishSeminoleSenegaleseSerbianShoshoneSierra LeoneanSiouxSlavicSlovakSloveneSomaliSouth AfricanSouth AmericanSouth American IndianSoviet UnionSpaniardSpanishSpanish AmericanSpanish American IndianSri LankanSubsaharan AfricanSudaneseSwedishSwissSyrianTaiwaneseThaiTlingit-HaidaTohono O'OdhamTonganTrinidadian and TobagonianTsimshianTurkishU.S. Virgin IslanderUgandanUkrainianUruguayanUteVenezuelanVietnameseWelshWest IndianYakamaYaquiYugoslavianYumanYup'ikZimbabwean
Immigration
NonimmigrantsImmigrantsAfghanistanAfricaAlbaniaArgentinaArmeniaAsiaAustraliaAustriaBahamasBangladeshBarbadosBelarusBelgiumBelizeBoliviaBosnia and HerzegovinaBrazilBulgariaBurma/MyanmarCabo VerdeCambodiaCameroonCanadaCaribbeanCentral AmericaChileChinaColombiaCongoCosta RicaCroatiaCubaCzechoslovakiaDenmarkDominicaDominican RepublicEastern AfricaEastern AsiaEastern EuropeEcuadorEgyptEl SalvadorEnglandEritreaEthiopiaEuropeFijiFranceGermanyGhanaGreeceGrenadaGuatemalaGuyanaHaitiHondurasHong KongHungaryIndiaIndonesiaIranIraqIrelandIsraelItalyJamaicaJapanJordanKazakhstanKenyaKoreaKuwaitLaosLatin AmericaLatviaLebanonLiberiaLithuaniaMalaysiaMexicoMicronesiaMiddle AfricaMoldovaMoroccoNepalNetherlandsNicaraguaNigeriaNorth AmericaNorth MacedoniaNorthern AfricaNorthern EuropeNorwayOceaniaPakistanPanamaPeruPhilippinesPolandPortugalRomaniaRussiaSaudi ArabiaScotlandSenegalSerbiaSierra LeoneSingaporeSomaliaSouth AfricaSouth AmericaSouth Central AsiaSouth Eastern AsiaSpainSri LankaSt. Vincent and the GrenadinesSudanSwedenSwitzerlandSyriaTaiwanThailandTrinidad and TobagoTurkeyUgandaUkraineUruguayUzbekistanVenezuelaVietnamWest IndiesWestern AfricaWestern AsiaWestern EuropeYemenZaireZimbabweAzores
Seniors Poverty Over the Age of 75
Income
Poverty
Unemployment
Labor Participation
Family Structure
Vehicle Availability
Education Level
Disability

Seniors Poverty Over the Age of 75 Comparison

Immigrants from Southern Europe

Bangladeshis

Poor
Good
12.7%
SENIORS POVERTY OVER THE AGE OF 75
10.7/ 100
METRIC RATING
203rd/ 347
METRIC RANK
12.0%
SENIORS POVERTY OVER THE AGE OF 75
70.4/ 100
METRIC RATING
146th/ 347
METRIC RANK

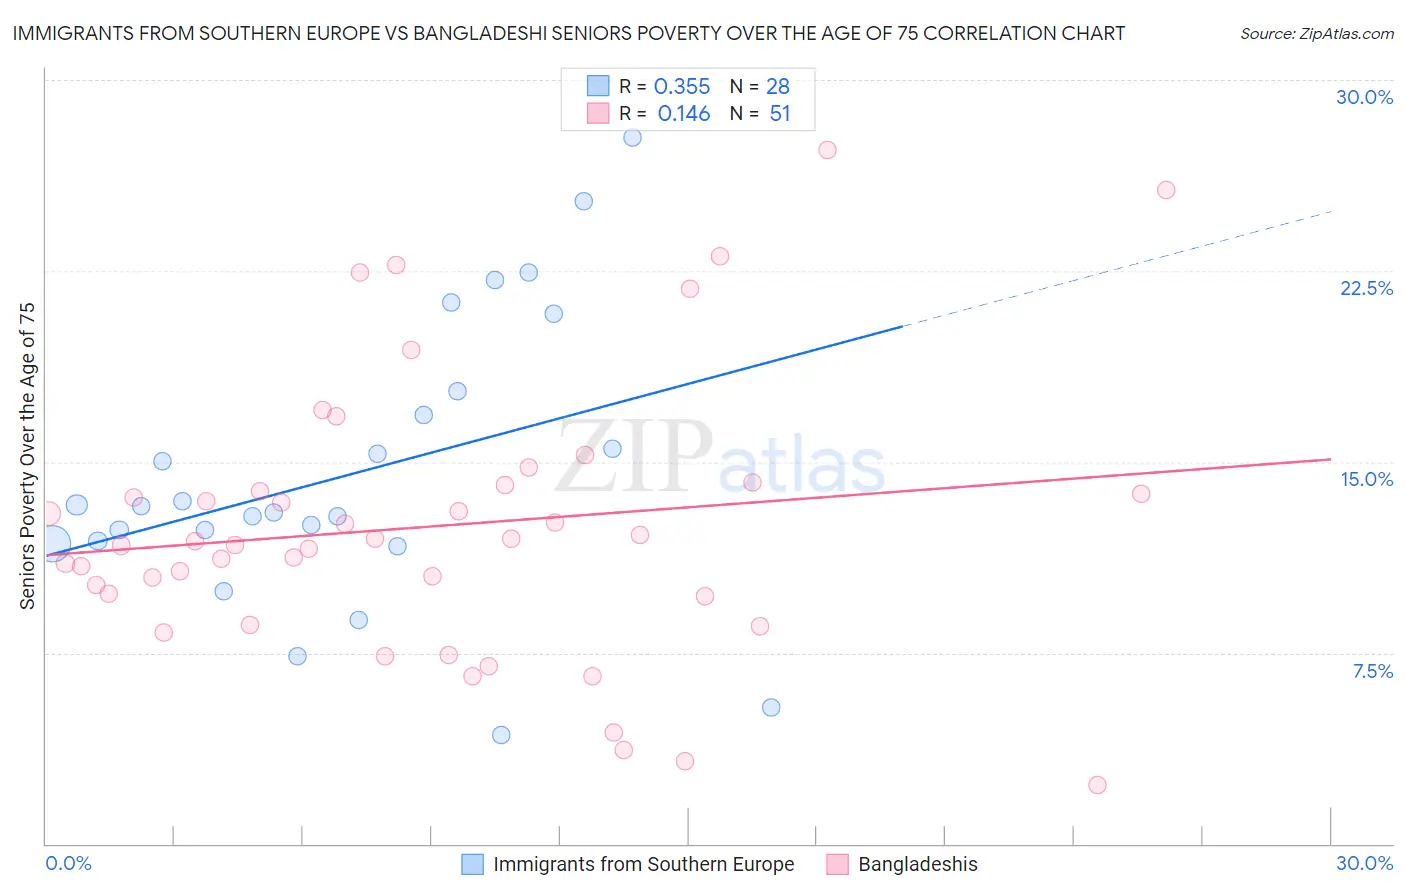
Immigrants from Southern Europe vs Bangladeshi Seniors Poverty Over the Age of 75 Correlation Chart

The statistical analysis conducted on geographies consisting of 398,215,767 people shows a mild positive correlation between the proportion of Immigrants from Southern Europe and poverty level among seniors over the age of 75 in the United States with a correlation coefficient (R) of 0.355 and weighted average of 12.7%. Similarly, the statistical analysis conducted on geographies consisting of 140,437,796 people shows a poor positive correlation between the proportion of Bangladeshis and poverty level among seniors over the age of 75 in the United States with a correlation coefficient (R) of 0.146 and weighted average of 12.0%, a difference of 6.2%.
Immigrants from Southern Europe vs Bangladeshi Seniors Poverty Over the Age of 75

Seniors Poverty Over the Age of 75 Correlation Summary

MeasurementImmigrants from Southern EuropeBangladeshi
Minimum4.3%2.3%
Maximum27.7%27.3%
Range23.5%24.9%
Mean14.5%12.5%
Median13.1%11.9%
Interquartile 25% (IQ1)11.8%9.7%
Interquartile 75% (IQ3)17.3%14.1%
Interquartile Range (IQR)5.5%4.3%
Standard Deviation (Sample)5.6%5.4%
Standard Deviation (Population)5.5%5.4%

Similar Demographics by Seniors Poverty Over the Age of 75

Demographics Similar to Immigrants from Southern Europe by Seniors Poverty Over the Age of 75

In terms of seniors poverty over the age of 75, the demographic groups most similar to Immigrants from Southern Europe are Immigrants from Eritrea (12.7%, a difference of 0.030%), Arapaho (12.7%, a difference of 0.060%), Paraguayan (12.7%, a difference of 0.090%), Indian (Asian) (12.7%, a difference of 0.19%), and Albanian (12.7%, a difference of 0.23%).
DemographicsRating | RankSeniors Poverty Over the Age of 75
Immigrants | Eastern Europe
16.0
/100
|
#196
Poor
12.6%
Nepalese
14.4
/100
|
#197
Poor
12.6%
Chileans
13.7
/100
|
#198
Poor
12.6%
Immigrants | Lebanon
12.7
/100
|
#199
Poor
12.7%
Immigrants | Vietnam
12.1
/100
|
#200
Poor
12.7%
Paraguayans
11.1
/100
|
#201
Poor
12.7%
Arapaho
10.9
/100
|
#202
Poor
12.7%
Immigrants | Southern Europe
10.7
/100
|
#203
Poor
12.7%
Immigrants | Eritrea
10.5
/100
|
#204
Poor
12.7%
Indians (Asian)
9.7
/100
|
#205
Tragic
12.7%
Albanians
9.6
/100
|
#206
Tragic
12.7%
Costa Ricans
8.7
/100
|
#207
Tragic
12.8%
Immigrants | Eastern Asia
8.4
/100
|
#208
Tragic
12.8%
Immigrants | Liberia
7.3
/100
|
#209
Tragic
12.8%
Comanche
7.0
/100
|
#210
Tragic
12.8%

Demographics Similar to Bangladeshis by Seniors Poverty Over the Age of 75

In terms of seniors poverty over the age of 75, the demographic groups most similar to Bangladeshis are Hmong (12.0%, a difference of 0.050%), Immigrants from Belgium (12.0%, a difference of 0.050%), American (12.0%, a difference of 0.060%), Immigrants from Laos (12.0%, a difference of 0.11%), and Immigrants from Latvia (12.0%, a difference of 0.12%).
DemographicsRating | RankSeniors Poverty Over the Age of 75
Immigrants | Kenya
72.6
/100
|
#139
Good
11.9%
Immigrants | Pakistan
71.9
/100
|
#140
Good
12.0%
Immigrants | Cameroon
71.7
/100
|
#141
Good
12.0%
Immigrants | Laos
71.5
/100
|
#142
Good
12.0%
Americans
71.0
/100
|
#143
Good
12.0%
Hmong
70.8
/100
|
#144
Good
12.0%
Immigrants | Belgium
70.8
/100
|
#145
Good
12.0%
Bangladeshis
70.4
/100
|
#146
Good
12.0%
Immigrants | Latvia
69.1
/100
|
#147
Good
12.0%
Immigrants | Zaire
67.6
/100
|
#148
Good
12.0%
Asians
67.4
/100
|
#149
Good
12.0%
Cypriots
67.3
/100
|
#150
Good
12.0%
Cherokee
65.8
/100
|
#151
Good
12.0%
Immigrants | Korea
65.5
/100
|
#152
Good
12.0%
Immigrants | Turkey
64.7
/100
|
#153
Good
12.0%