Immigrants from England vs Immigrants from Micronesia Seniors Poverty Over the Age of 75
COMPARE
Immigrants from England
Immigrants from Micronesia
Seniors Poverty Over the Age of 75
Seniors Poverty Over the Age of 75 Comparison
Immigrants from England
Immigrants from Micronesia
11.2%
SENIORS POVERTY OVER THE AGE OF 75
98.4/ 100
METRIC RATING
53rd/ 347
METRIC RANK
11.4%
SENIORS POVERTY OVER THE AGE OF 75
96.0/ 100
METRIC RATING
73rd/ 347
METRIC RANK
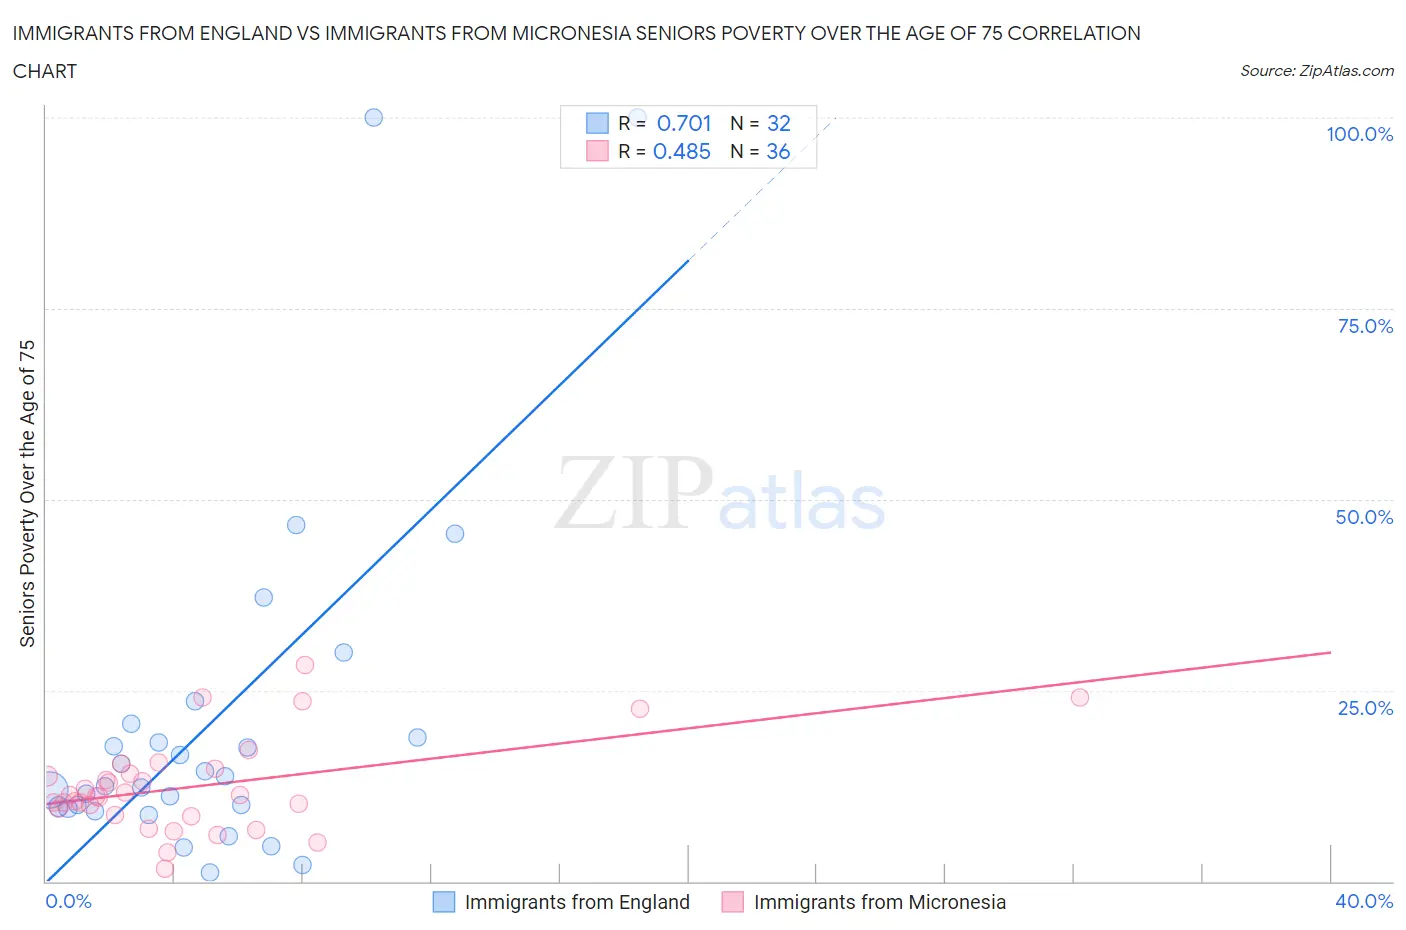
Immigrants from England vs Immigrants from Micronesia Seniors Poverty Over the Age of 75 Correlation Chart
The statistical analysis conducted on geographies consisting of 387,454,301 people shows a strong positive correlation between the proportion of Immigrants from England and poverty level among seniors over the age of 75 in the United States with a correlation coefficient (R) of 0.701 and weighted average of 11.2%. Similarly, the statistical analysis conducted on geographies consisting of 61,139,167 people shows a moderate positive correlation between the proportion of Immigrants from Micronesia and poverty level among seniors over the age of 75 in the United States with a correlation coefficient (R) of 0.485 and weighted average of 11.4%, a difference of 2.1%.
Seniors Poverty Over the Age of 75 Correlation Summary
| Measurement | Immigrants from England | Immigrants from Micronesia |
| Minimum | 1.1% | 1.7% |
| Maximum | 100.0% | 28.3% |
| Range | 98.9% | 26.6% |
| Mean | 20.9% | 12.4% |
| Median | 13.1% | 11.2% |
| Interquartile 25% (IQ1) | 9.7% | 9.1% |
| Interquartile 75% (IQ3) | 19.7% | 14.5% |
| Interquartile Range (IQR) | 10.0% | 5.4% |
| Standard Deviation (Sample) | 23.4% | 6.0% |
| Standard Deviation (Population) | 23.1% | 5.9% |
Demographics Similar to Immigrants from England and Immigrants from Micronesia by Seniors Poverty Over the Age of 75
In terms of seniors poverty over the age of 75, the demographic groups most similar to Immigrants from England are Afghan (11.2%, a difference of 0.32%), Hungarian (11.2%, a difference of 0.39%), Slavic (11.2%, a difference of 0.40%), Immigrants from Canada (11.2%, a difference of 0.63%), and Yugoslavian (11.2%, a difference of 0.67%). Similarly, the demographic groups most similar to Immigrants from Micronesia are Sierra Leonean (11.4%, a difference of 0.090%), Osage (11.4%, a difference of 0.18%), Immigrants from South Central Asia (11.4%, a difference of 0.26%), Ottawa (11.4%, a difference of 0.30%), and Immigrants from Austria (11.4%, a difference of 0.31%).
| Demographics | Rating | Rank | Seniors Poverty Over the Age of 75 |
| Immigrants | England | 98.4 /100 | #53 | Exceptional 11.2% |
| Afghans | 98.2 /100 | #54 | Exceptional 11.2% |
| Hungarians | 98.1 /100 | #55 | Exceptional 11.2% |
| Slavs | 98.1 /100 | #56 | Exceptional 11.2% |
| Immigrants | Canada | 97.9 /100 | #57 | Exceptional 11.2% |
| Yugoslavians | 97.9 /100 | #58 | Exceptional 11.2% |
| Immigrants | Netherlands | 97.8 /100 | #59 | Exceptional 11.2% |
| Eastern Europeans | 97.7 /100 | #60 | Exceptional 11.3% |
| Canadians | 97.7 /100 | #61 | Exceptional 11.3% |
| Immigrants | North America | 97.6 /100 | #62 | Exceptional 11.3% |
| Immigrants | Afghanistan | 97.5 /100 | #63 | Exceptional 11.3% |
| Immigrants | Northern Europe | 97.4 /100 | #64 | Exceptional 11.3% |
| Immigrants | Taiwan | 96.7 /100 | #65 | Exceptional 11.4% |
| Estonians | 96.7 /100 | #66 | Exceptional 11.4% |
| Bolivians | 96.5 /100 | #67 | Exceptional 11.4% |
| Immigrants | Austria | 96.5 /100 | #68 | Exceptional 11.4% |
| Ottawa | 96.5 /100 | #69 | Exceptional 11.4% |
| Immigrants | South Central Asia | 96.4 /100 | #70 | Exceptional 11.4% |
| Osage | 96.3 /100 | #71 | Exceptional 11.4% |
| Sierra Leoneans | 96.1 /100 | #72 | Exceptional 11.4% |
| Immigrants | Micronesia | 96.0 /100 | #73 | Exceptional 11.4% |