Honduran vs Immigrants from Micronesia Seniors Poverty Over the Age of 75
COMPARE
Honduran
Immigrants from Micronesia
Seniors Poverty Over the Age of 75
Seniors Poverty Over the Age of 75 Comparison
Hondurans
Immigrants from Micronesia
15.4%
SENIORS POVERTY OVER THE AGE OF 75
0.0/ 100
METRIC RATING
297th/ 347
METRIC RANK
11.4%
SENIORS POVERTY OVER THE AGE OF 75
96.0/ 100
METRIC RATING
73rd/ 347
METRIC RANK
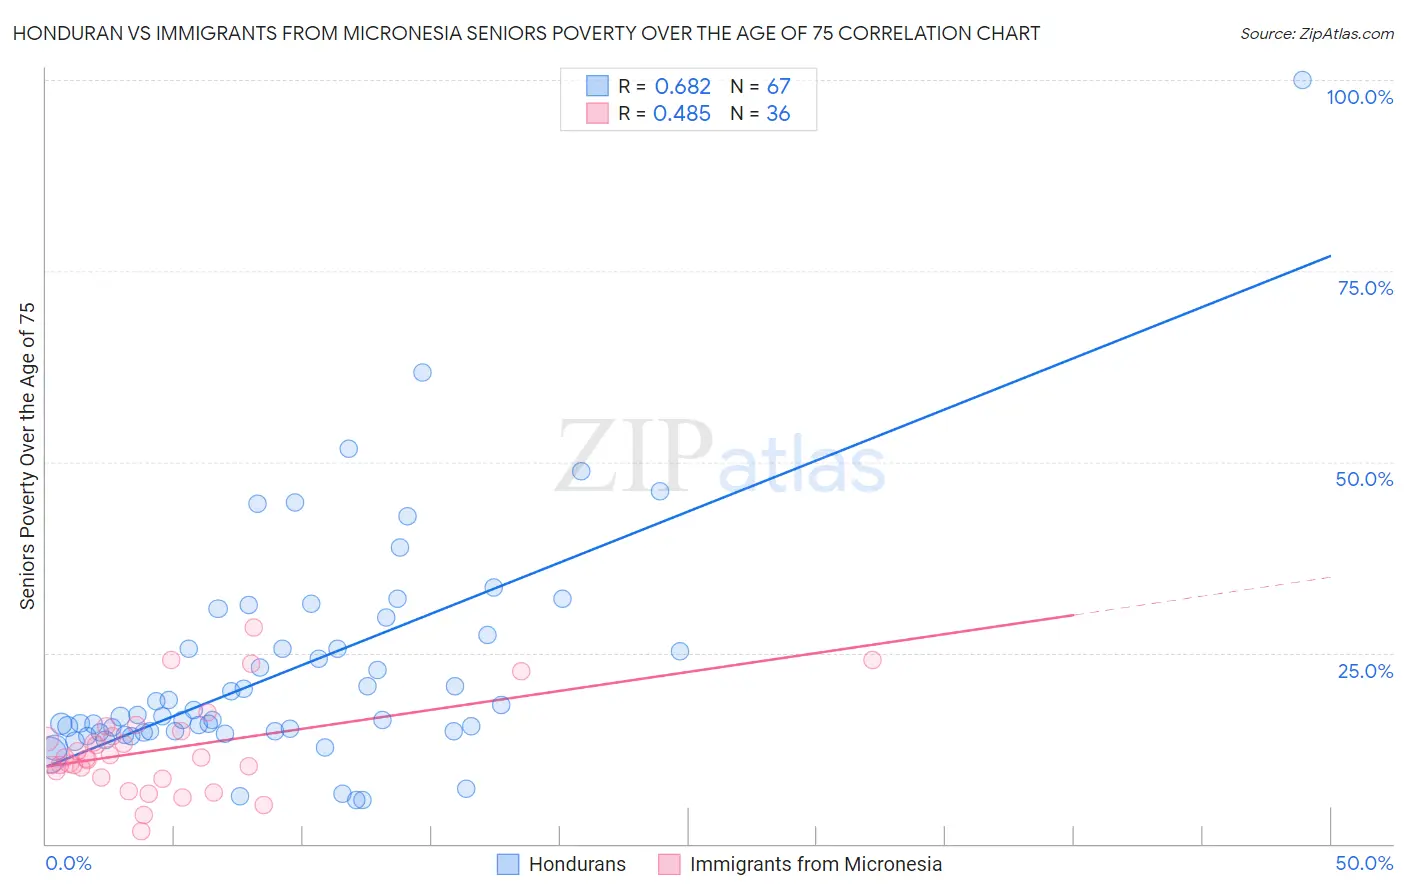
Honduran vs Immigrants from Micronesia Seniors Poverty Over the Age of 75 Correlation Chart
The statistical analysis conducted on geographies consisting of 354,613,309 people shows a significant positive correlation between the proportion of Hondurans and poverty level among seniors over the age of 75 in the United States with a correlation coefficient (R) of 0.682 and weighted average of 15.4%. Similarly, the statistical analysis conducted on geographies consisting of 61,139,167 people shows a moderate positive correlation between the proportion of Immigrants from Micronesia and poverty level among seniors over the age of 75 in the United States with a correlation coefficient (R) of 0.485 and weighted average of 11.4%, a difference of 35.4%.
Seniors Poverty Over the Age of 75 Correlation Summary
| Measurement | Honduran | Immigrants from Micronesia |
| Minimum | 5.7% | 1.7% |
| Maximum | 100.0% | 28.3% |
| Range | 94.3% | 26.6% |
| Mean | 22.9% | 12.4% |
| Median | 16.7% | 11.2% |
| Interquartile 25% (IQ1) | 14.7% | 9.1% |
| Interquartile 75% (IQ3) | 27.3% | 14.5% |
| Interquartile Range (IQR) | 12.6% | 5.4% |
| Standard Deviation (Sample) | 15.1% | 6.0% |
| Standard Deviation (Population) | 15.0% | 5.9% |
Similar Demographics by Seniors Poverty Over the Age of 75
Demographics Similar to Hondurans by Seniors Poverty Over the Age of 75
In terms of seniors poverty over the age of 75, the demographic groups most similar to Hondurans are Yuman (15.4%, a difference of 0.28%), Native/Alaskan (15.5%, a difference of 0.34%), Spanish American Indian (15.5%, a difference of 0.44%), Bahamian (15.5%, a difference of 0.45%), and U.S. Virgin Islander (15.4%, a difference of 0.46%).
| Demographics | Rating | Rank | Seniors Poverty Over the Age of 75 |
| Immigrants | Azores | 0.0 /100 | #290 | Tragic 15.2% |
| Paiute | 0.0 /100 | #291 | Tragic 15.2% |
| Colville | 0.0 /100 | #292 | Tragic 15.2% |
| Apache | 0.0 /100 | #293 | Tragic 15.3% |
| Immigrants | Jamaica | 0.0 /100 | #294 | Tragic 15.3% |
| U.S. Virgin Islanders | 0.0 /100 | #295 | Tragic 15.4% |
| Yuman | 0.0 /100 | #296 | Tragic 15.4% |
| Hondurans | 0.0 /100 | #297 | Tragic 15.4% |
| Natives/Alaskans | 0.0 /100 | #298 | Tragic 15.5% |
| Spanish American Indians | 0.0 /100 | #299 | Tragic 15.5% |
| Bahamians | 0.0 /100 | #300 | Tragic 15.5% |
| Immigrants | Latin America | 0.0 /100 | #301 | Tragic 15.6% |
| West Indians | 0.0 /100 | #302 | Tragic 15.7% |
| Immigrants | Honduras | 0.0 /100 | #303 | Tragic 15.7% |
| Immigrants | Trinidad and Tobago | 0.0 /100 | #304 | Tragic 15.7% |
Demographics Similar to Immigrants from Micronesia by Seniors Poverty Over the Age of 75
In terms of seniors poverty over the age of 75, the demographic groups most similar to Immigrants from Micronesia are Delaware (11.4%, a difference of 0.010%), Sierra Leonean (11.4%, a difference of 0.090%), Palestinian (11.4%, a difference of 0.11%), French Canadian (11.4%, a difference of 0.17%), and Osage (11.4%, a difference of 0.18%).
| Demographics | Rating | Rank | Seniors Poverty Over the Age of 75 |
| Estonians | 96.7 /100 | #66 | Exceptional 11.4% |
| Bolivians | 96.5 /100 | #67 | Exceptional 11.4% |
| Immigrants | Austria | 96.5 /100 | #68 | Exceptional 11.4% |
| Ottawa | 96.5 /100 | #69 | Exceptional 11.4% |
| Immigrants | South Central Asia | 96.4 /100 | #70 | Exceptional 11.4% |
| Osage | 96.3 /100 | #71 | Exceptional 11.4% |
| Sierra Leoneans | 96.1 /100 | #72 | Exceptional 11.4% |
| Immigrants | Micronesia | 96.0 /100 | #73 | Exceptional 11.4% |
| Delaware | 96.0 /100 | #74 | Exceptional 11.4% |
| Palestinians | 95.8 /100 | #75 | Exceptional 11.4% |
| French Canadians | 95.7 /100 | #76 | Exceptional 11.4% |
| Whites/Caucasians | 95.5 /100 | #77 | Exceptional 11.4% |
| Macedonians | 95.5 /100 | #78 | Exceptional 11.4% |
| Filipinos | 95.5 /100 | #79 | Exceptional 11.4% |
| Alaska Natives | 95.4 /100 | #80 | Exceptional 11.4% |