Immigrants from England vs Thai Seniors Poverty Over the Age of 75
COMPARE
Immigrants from England
Thai
Seniors Poverty Over the Age of 75
Seniors Poverty Over the Age of 75 Comparison
Immigrants from England
Thais
11.2%
SENIORS POVERTY OVER THE AGE OF 75
98.4/ 100
METRIC RATING
53rd/ 347
METRIC RANK
10.9%
SENIORS POVERTY OVER THE AGE OF 75
99.4/ 100
METRIC RATING
40th/ 347
METRIC RANK
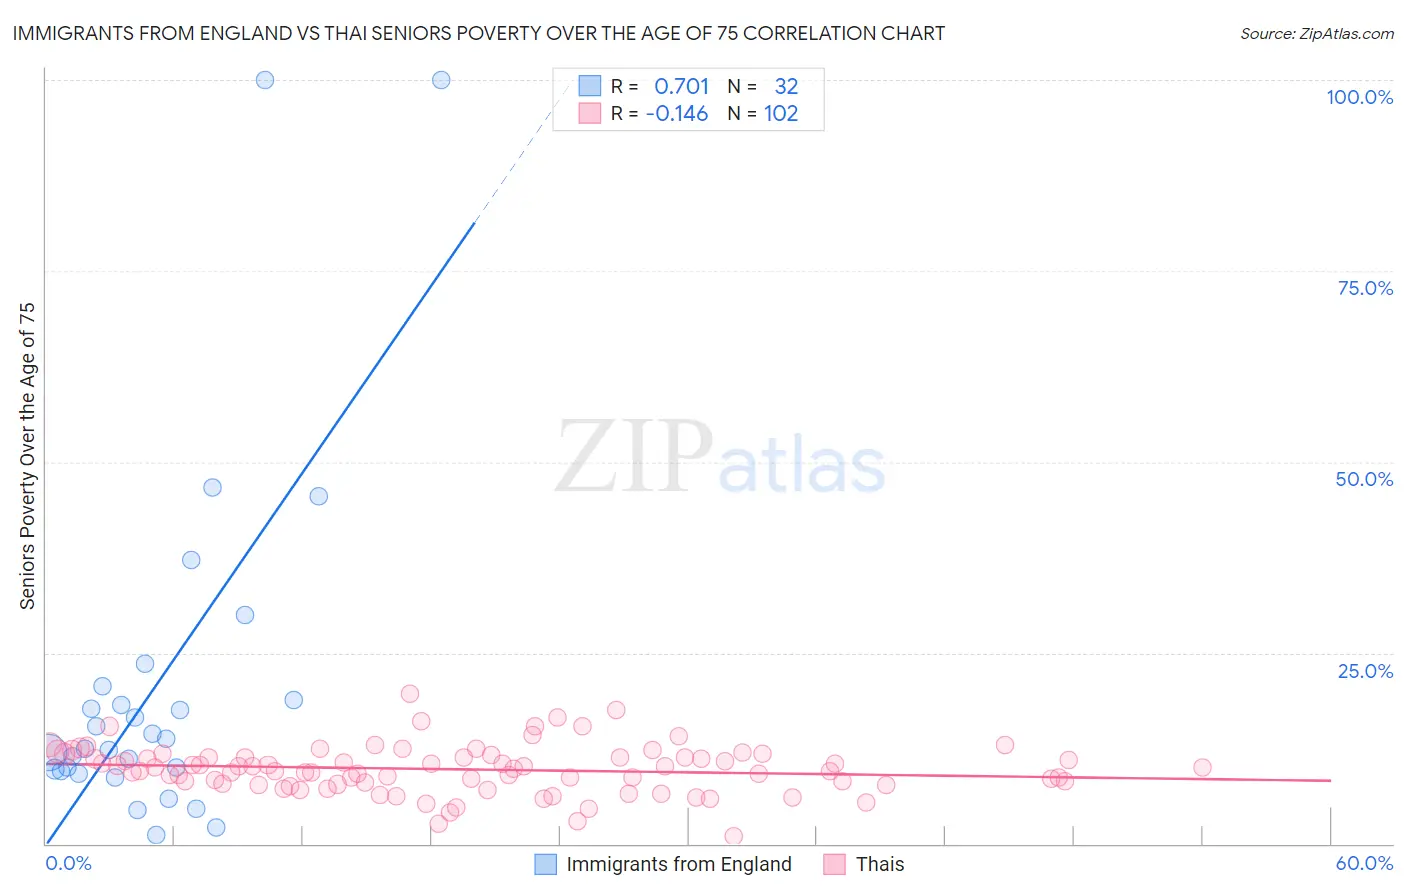
Immigrants from England vs Thai Seniors Poverty Over the Age of 75 Correlation Chart
The statistical analysis conducted on geographies consisting of 387,454,301 people shows a strong positive correlation between the proportion of Immigrants from England and poverty level among seniors over the age of 75 in the United States with a correlation coefficient (R) of 0.701 and weighted average of 11.2%. Similarly, the statistical analysis conducted on geographies consisting of 468,192,905 people shows a poor negative correlation between the proportion of Thais and poverty level among seniors over the age of 75 in the United States with a correlation coefficient (R) of -0.146 and weighted average of 10.9%, a difference of 2.1%.
Seniors Poverty Over the Age of 75 Correlation Summary
| Measurement | Immigrants from England | Thai |
| Minimum | 1.1% | 0.92% |
| Maximum | 100.0% | 19.7% |
| Range | 98.9% | 18.8% |
| Mean | 20.9% | 9.7% |
| Median | 13.1% | 9.9% |
| Interquartile 25% (IQ1) | 9.7% | 7.9% |
| Interquartile 75% (IQ3) | 19.7% | 11.3% |
| Interquartile Range (IQR) | 10.0% | 3.4% |
| Standard Deviation (Sample) | 23.4% | 3.1% |
| Standard Deviation (Population) | 23.1% | 3.1% |
Demographics Similar to Immigrants from England and Thais by Seniors Poverty Over the Age of 75
In terms of seniors poverty over the age of 75, the demographic groups most similar to Immigrants from England are Zimbabwean (11.2%, a difference of 0.070%), Immigrants from North Macedonia (11.1%, a difference of 0.22%), Serbian (11.1%, a difference of 0.25%), Afghan (11.2%, a difference of 0.32%), and Samoan (11.1%, a difference of 0.36%). Similarly, the demographic groups most similar to Thais are Czechoslovakian (10.9%, a difference of 0.22%), Immigrants from Lithuania (11.0%, a difference of 0.49%), Austrian (11.0%, a difference of 0.76%), Celtic (11.0%, a difference of 0.81%), and Finnish (10.8%, a difference of 0.84%).
| Demographics | Rating | Rank | Seniors Poverty Over the Age of 75 |
| Scotch-Irish | 99.6 /100 | #36 | Exceptional 10.8% |
| Latvians | 99.6 /100 | #37 | Exceptional 10.8% |
| Finns | 99.6 /100 | #38 | Exceptional 10.8% |
| Czechoslovakians | 99.4 /100 | #39 | Exceptional 10.9% |
| Thais | 99.4 /100 | #40 | Exceptional 10.9% |
| Immigrants | Lithuania | 99.2 /100 | #41 | Exceptional 11.0% |
| Austrians | 99.1 /100 | #42 | Exceptional 11.0% |
| Celtics | 99.1 /100 | #43 | Exceptional 11.0% |
| Belgians | 99.1 /100 | #44 | Exceptional 11.0% |
| Carpatho Rusyns | 99.0 /100 | #45 | Exceptional 11.1% |
| Greeks | 99.0 /100 | #46 | Exceptional 11.1% |
| Hawaiians | 98.8 /100 | #47 | Exceptional 11.1% |
| French | 98.7 /100 | #48 | Exceptional 11.1% |
| Samoans | 98.7 /100 | #49 | Exceptional 11.1% |
| Serbians | 98.6 /100 | #50 | Exceptional 11.1% |
| Immigrants | North Macedonia | 98.6 /100 | #51 | Exceptional 11.1% |
| Zimbabweans | 98.5 /100 | #52 | Exceptional 11.2% |
| Immigrants | England | 98.4 /100 | #53 | Exceptional 11.2% |
| Afghans | 98.2 /100 | #54 | Exceptional 11.2% |
| Hungarians | 98.1 /100 | #55 | Exceptional 11.2% |
| Slavs | 98.1 /100 | #56 | Exceptional 11.2% |