Immigrants from El Salvador vs Immigrants from North America Seniors Poverty Over the Age of 65
COMPARE
Immigrants from El Salvador
Immigrants from North America
Seniors Poverty Over the Age of 65
Seniors Poverty Over the Age of 65 Comparison
Immigrants from El Salvador
Immigrants from North America
13.1%
SENIORS POVERTY OVER THE AGE OF 65
0.0/ 100
METRIC RATING
281st/ 347
METRIC RANK
9.9%
SENIORS POVERTY OVER THE AGE OF 65
98.8/ 100
METRIC RATING
64th/ 347
METRIC RANK
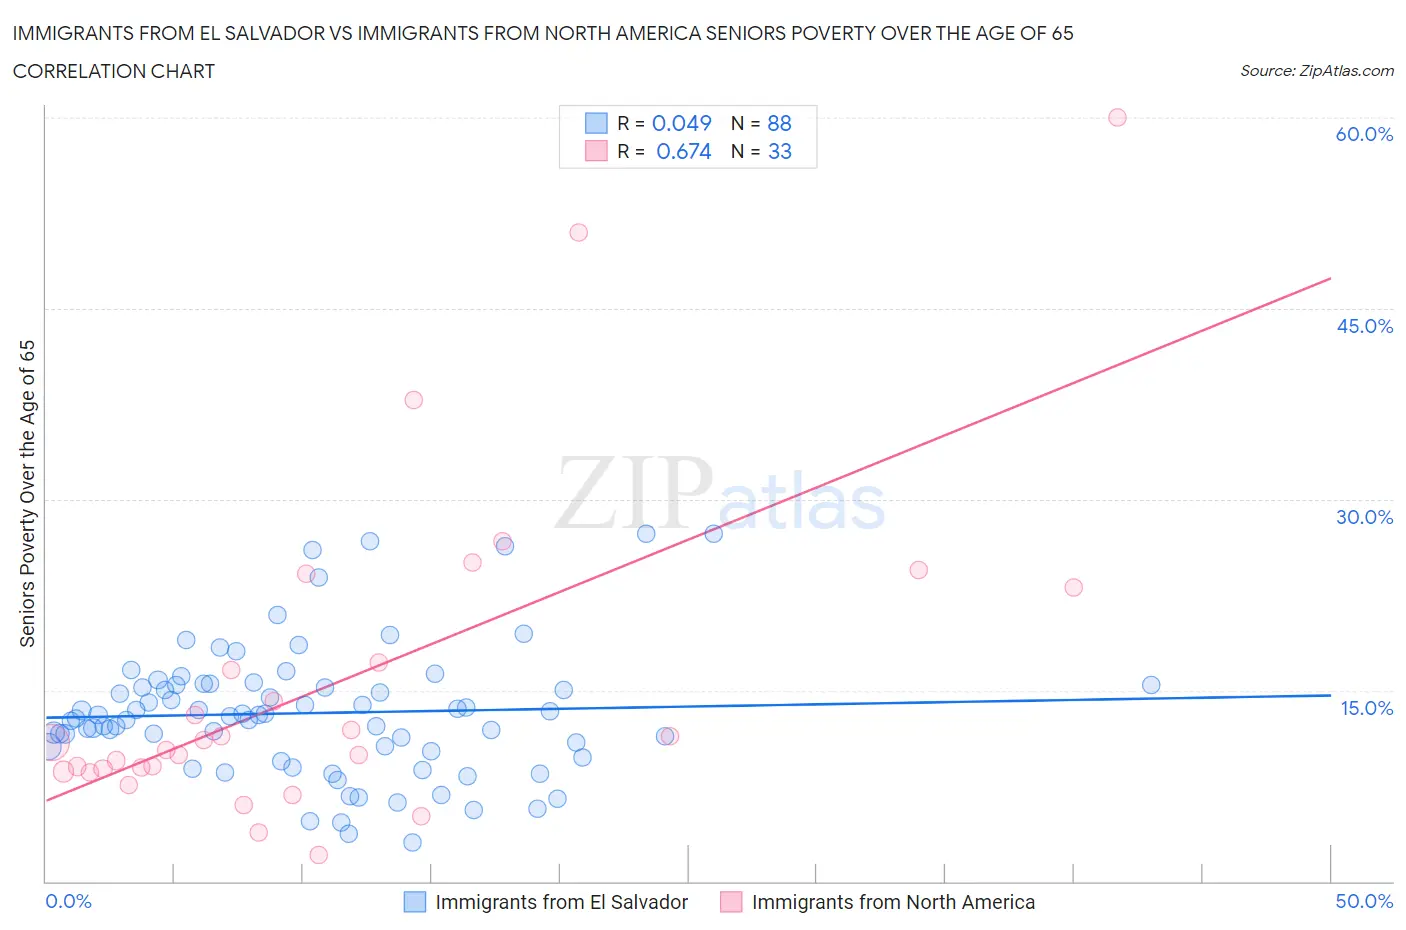
Immigrants from El Salvador vs Immigrants from North America Seniors Poverty Over the Age of 65 Correlation Chart
The statistical analysis conducted on geographies consisting of 356,923,596 people shows no correlation between the proportion of Immigrants from El Salvador and poverty level among seniors over the age of 65 in the United States with a correlation coefficient (R) of 0.049 and weighted average of 13.1%. Similarly, the statistical analysis conducted on geographies consisting of 460,378,819 people shows a significant positive correlation between the proportion of Immigrants from North America and poverty level among seniors over the age of 65 in the United States with a correlation coefficient (R) of 0.674 and weighted average of 9.9%, a difference of 33.2%.
Seniors Poverty Over the Age of 65 Correlation Summary
| Measurement | Immigrants from El Salvador | Immigrants from North America |
| Minimum | 3.0% | 2.1% |
| Maximum | 27.3% | 60.0% |
| Range | 24.3% | 57.9% |
| Mean | 13.2% | 15.6% |
| Median | 13.0% | 10.9% |
| Interquartile 25% (IQ1) | 10.4% | 8.7% |
| Interquartile 75% (IQ3) | 15.4% | 20.1% |
| Interquartile Range (IQR) | 5.0% | 11.4% |
| Standard Deviation (Sample) | 5.1% | 12.9% |
| Standard Deviation (Population) | 5.1% | 12.7% |
Similar Demographics by Seniors Poverty Over the Age of 65
Demographics Similar to Immigrants from El Salvador by Seniors Poverty Over the Age of 65
In terms of seniors poverty over the age of 65, the demographic groups most similar to Immigrants from El Salvador are Yuman (13.1%, a difference of 0.44%), Mexican (13.1%, a difference of 0.48%), Immigrants from Bahamas (13.0%, a difference of 0.64%), Senegalese (13.3%, a difference of 1.1%), and Paiute (12.9%, a difference of 1.5%).
| Demographics | Rating | Rank | Seniors Poverty Over the Age of 65 |
| Salvadorans | 0.0 /100 | #274 | Tragic 12.8% |
| Immigrants | Colombia | 0.0 /100 | #275 | Tragic 12.9% |
| Immigrants | Azores | 0.0 /100 | #276 | Tragic 12.9% |
| Paiute | 0.0 /100 | #277 | Tragic 12.9% |
| Immigrants | Bahamas | 0.0 /100 | #278 | Tragic 13.0% |
| Mexicans | 0.0 /100 | #279 | Tragic 13.1% |
| Yuman | 0.0 /100 | #280 | Tragic 13.1% |
| Immigrants | El Salvador | 0.0 /100 | #281 | Tragic 13.1% |
| Senegalese | 0.0 /100 | #282 | Tragic 13.3% |
| Central Americans | 0.0 /100 | #283 | Tragic 13.4% |
| Colville | 0.0 /100 | #284 | Tragic 13.5% |
| Guatemalans | 0.0 /100 | #285 | Tragic 13.5% |
| Immigrants | Senegal | 0.0 /100 | #286 | Tragic 13.6% |
| Immigrants | Mexico | 0.0 /100 | #287 | Tragic 13.6% |
| Belizeans | 0.0 /100 | #288 | Tragic 13.6% |
Demographics Similar to Immigrants from North America by Seniors Poverty Over the Age of 65
In terms of seniors poverty over the age of 65, the demographic groups most similar to Immigrants from North America are Macedonian (9.9%, a difference of 0.050%), French Canadian (9.8%, a difference of 0.23%), Iranian (9.8%, a difference of 0.27%), Pennsylvania German (9.9%, a difference of 0.28%), and Immigrants from Netherlands (9.9%, a difference of 0.33%).
| Demographics | Rating | Rank | Seniors Poverty Over the Age of 65 |
| Bolivians | 99.1 /100 | #57 | Exceptional 9.8% |
| Serbians | 99.1 /100 | #58 | Exceptional 9.8% |
| Immigrants | Canada | 99.0 /100 | #59 | Exceptional 9.8% |
| Celtics | 99.0 /100 | #60 | Exceptional 9.8% |
| Iranians | 98.9 /100 | #61 | Exceptional 9.8% |
| French Canadians | 98.9 /100 | #62 | Exceptional 9.8% |
| Macedonians | 98.8 /100 | #63 | Exceptional 9.9% |
| Immigrants | North America | 98.8 /100 | #64 | Exceptional 9.9% |
| Pennsylvania Germans | 98.7 /100 | #65 | Exceptional 9.9% |
| Immigrants | Netherlands | 98.7 /100 | #66 | Exceptional 9.9% |
| Immigrants | Austria | 98.6 /100 | #67 | Exceptional 9.9% |
| Canadians | 98.5 /100 | #68 | Exceptional 9.9% |
| Australians | 98.4 /100 | #69 | Exceptional 9.9% |
| Samoans | 98.0 /100 | #70 | Exceptional 10.0% |
| Yugoslavians | 97.9 /100 | #71 | Exceptional 10.0% |