Immigrants from El Salvador vs Cree Seniors Poverty Over the Age of 65
COMPARE
Immigrants from El Salvador
Cree
Seniors Poverty Over the Age of 65
Seniors Poverty Over the Age of 65 Comparison
Immigrants from El Salvador
Cree
13.1%
SENIORS POVERTY OVER THE AGE OF 65
0.0/ 100
METRIC RATING
281st/ 347
METRIC RANK
12.1%
SENIORS POVERTY OVER THE AGE OF 65
0.7/ 100
METRIC RATING
246th/ 347
METRIC RANK
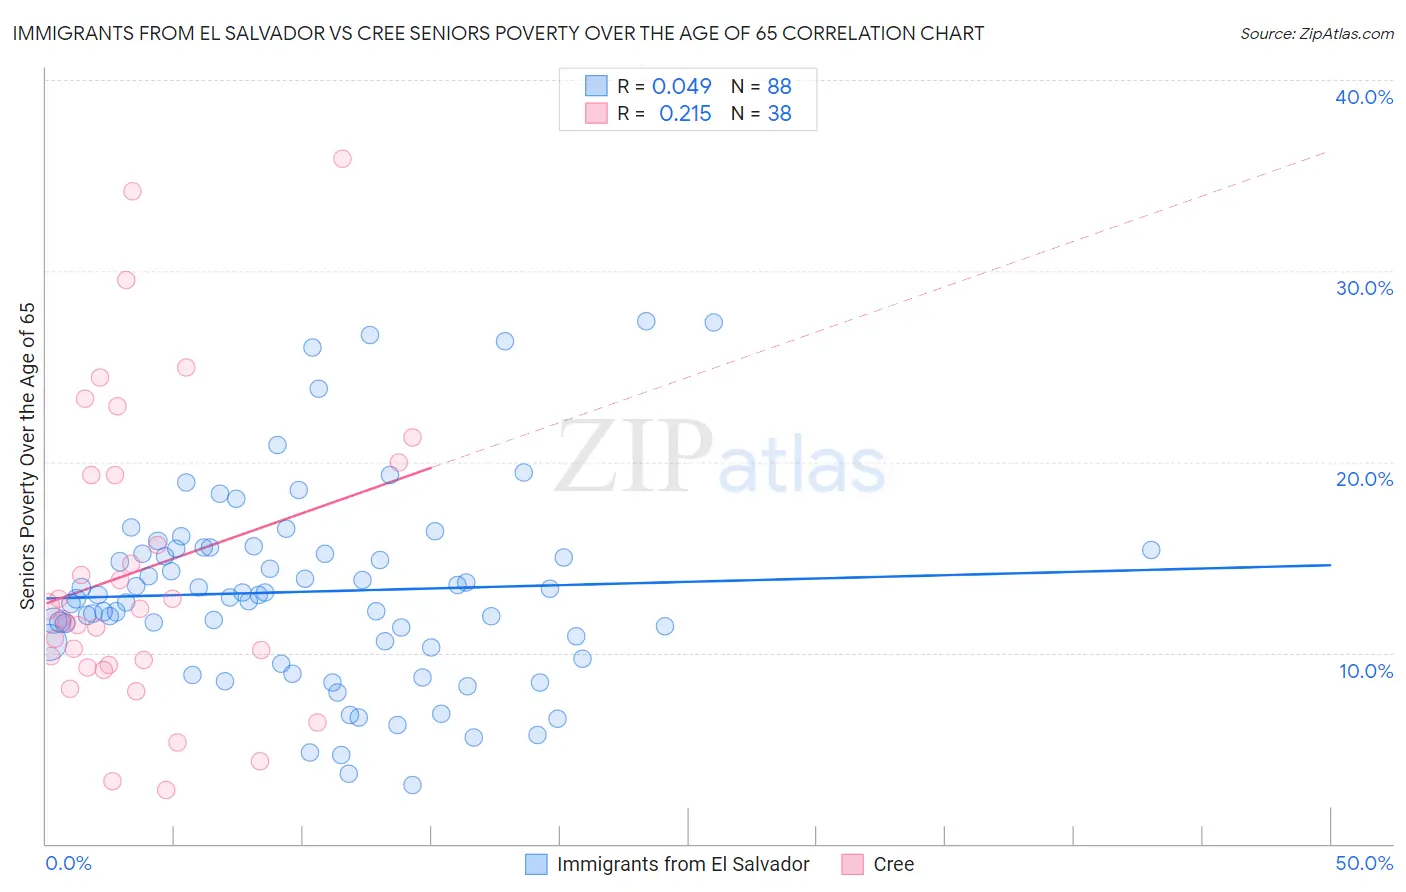
Immigrants from El Salvador vs Cree Seniors Poverty Over the Age of 65 Correlation Chart
The statistical analysis conducted on geographies consisting of 356,923,596 people shows no correlation between the proportion of Immigrants from El Salvador and poverty level among seniors over the age of 65 in the United States with a correlation coefficient (R) of 0.049 and weighted average of 13.1%. Similarly, the statistical analysis conducted on geographies consisting of 76,178,735 people shows a weak positive correlation between the proportion of Cree and poverty level among seniors over the age of 65 in the United States with a correlation coefficient (R) of 0.215 and weighted average of 12.1%, a difference of 8.1%.
Seniors Poverty Over the Age of 65 Correlation Summary
| Measurement | Immigrants from El Salvador | Cree |
| Minimum | 3.0% | 2.8% |
| Maximum | 27.3% | 35.9% |
| Range | 24.3% | 33.1% |
| Mean | 13.2% | 14.4% |
| Median | 13.0% | 12.1% |
| Interquartile 25% (IQ1) | 10.4% | 9.3% |
| Interquartile 75% (IQ3) | 15.4% | 19.3% |
| Interquartile Range (IQR) | 5.0% | 10.0% |
| Standard Deviation (Sample) | 5.1% | 8.0% |
| Standard Deviation (Population) | 5.1% | 7.9% |
Similar Demographics by Seniors Poverty Over the Age of 65
Demographics Similar to Immigrants from El Salvador by Seniors Poverty Over the Age of 65
In terms of seniors poverty over the age of 65, the demographic groups most similar to Immigrants from El Salvador are Yuman (13.1%, a difference of 0.44%), Mexican (13.1%, a difference of 0.48%), Immigrants from Bahamas (13.0%, a difference of 0.64%), Senegalese (13.3%, a difference of 1.1%), and Paiute (12.9%, a difference of 1.5%).
| Demographics | Rating | Rank | Seniors Poverty Over the Age of 65 |
| Salvadorans | 0.0 /100 | #274 | Tragic 12.8% |
| Immigrants | Colombia | 0.0 /100 | #275 | Tragic 12.9% |
| Immigrants | Azores | 0.0 /100 | #276 | Tragic 12.9% |
| Paiute | 0.0 /100 | #277 | Tragic 12.9% |
| Immigrants | Bahamas | 0.0 /100 | #278 | Tragic 13.0% |
| Mexicans | 0.0 /100 | #279 | Tragic 13.1% |
| Yuman | 0.0 /100 | #280 | Tragic 13.1% |
| Immigrants | El Salvador | 0.0 /100 | #281 | Tragic 13.1% |
| Senegalese | 0.0 /100 | #282 | Tragic 13.3% |
| Central Americans | 0.0 /100 | #283 | Tragic 13.4% |
| Colville | 0.0 /100 | #284 | Tragic 13.5% |
| Guatemalans | 0.0 /100 | #285 | Tragic 13.5% |
| Immigrants | Senegal | 0.0 /100 | #286 | Tragic 13.6% |
| Immigrants | Mexico | 0.0 /100 | #287 | Tragic 13.6% |
| Belizeans | 0.0 /100 | #288 | Tragic 13.6% |
Demographics Similar to Cree by Seniors Poverty Over the Age of 65
In terms of seniors poverty over the age of 65, the demographic groups most similar to Cree are Chippewa (12.1%, a difference of 0.11%), Japanese (12.2%, a difference of 0.11%), Spanish American (12.2%, a difference of 0.12%), Ute (12.2%, a difference of 0.17%), and Immigrants from Portugal (12.1%, a difference of 0.22%).
| Demographics | Rating | Rank | Seniors Poverty Over the Age of 65 |
| Immigrants | Spain | 1.0 /100 | #239 | Tragic 12.1% |
| Comanche | 0.9 /100 | #240 | Tragic 12.1% |
| Immigrants | Albania | 0.9 /100 | #241 | Tragic 12.1% |
| Sub-Saharan Africans | 0.9 /100 | #242 | Tragic 12.1% |
| Uruguayans | 0.8 /100 | #243 | Tragic 12.1% |
| Immigrants | Portugal | 0.8 /100 | #244 | Tragic 12.1% |
| Chippewa | 0.7 /100 | #245 | Tragic 12.1% |
| Cree | 0.7 /100 | #246 | Tragic 12.1% |
| Japanese | 0.6 /100 | #247 | Tragic 12.2% |
| Spanish Americans | 0.6 /100 | #248 | Tragic 12.2% |
| Ute | 0.6 /100 | #249 | Tragic 12.2% |
| Immigrants | Liberia | 0.5 /100 | #250 | Tragic 12.2% |
| Somalis | 0.3 /100 | #251 | Tragic 12.3% |
| Armenians | 0.3 /100 | #252 | Tragic 12.3% |
| Shoshone | 0.3 /100 | #253 | Tragic 12.3% |