Immigrants from Ecuador vs Immigrants from Nigeria Female Poverty Among 25-34 Year Olds
COMPARE
Immigrants from Ecuador
Immigrants from Nigeria
Female Poverty Among 25-34 Year Olds
Female Poverty Among 25-34 Year Olds Comparison
Immigrants from Ecuador
Immigrants from Nigeria
14.6%
FEMALE POVERTY AMONG 25-34 YEAR OLDS
1.9/ 100
METRIC RATING
232nd/ 347
METRIC RANK
14.3%
FEMALE POVERTY AMONG 25-34 YEAR OLDS
6.2/ 100
METRIC RATING
215th/ 347
METRIC RANK
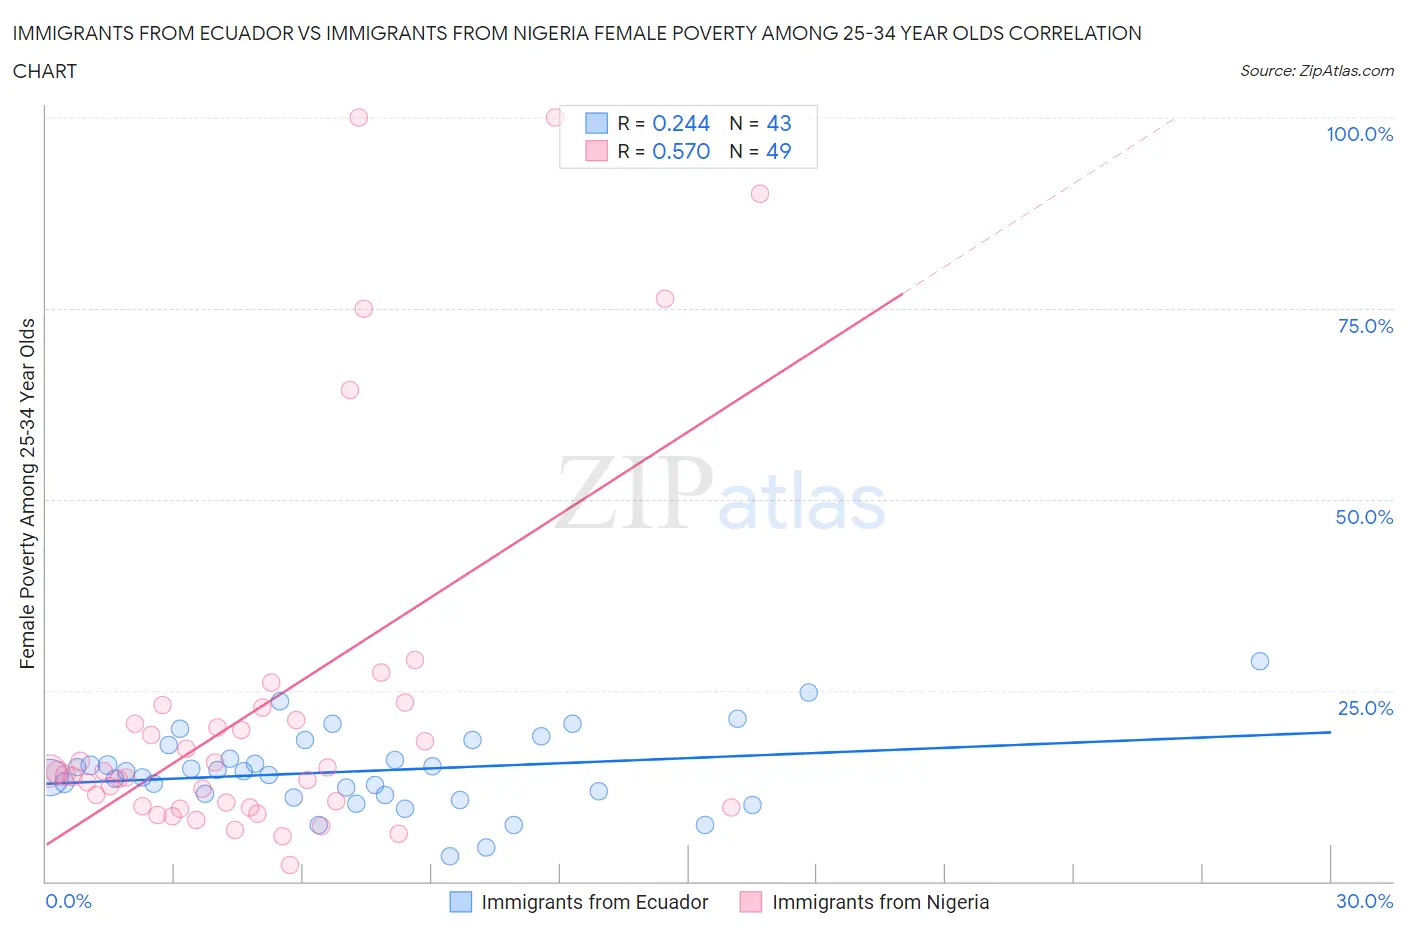
Immigrants from Ecuador vs Immigrants from Nigeria Female Poverty Among 25-34 Year Olds Correlation Chart
The statistical analysis conducted on geographies consisting of 268,011,049 people shows a weak positive correlation between the proportion of Immigrants from Ecuador and poverty level among females between the ages 25 and 34 in the United States with a correlation coefficient (R) of 0.244 and weighted average of 14.6%. Similarly, the statistical analysis conducted on geographies consisting of 281,135,990 people shows a substantial positive correlation between the proportion of Immigrants from Nigeria and poverty level among females between the ages 25 and 34 in the United States with a correlation coefficient (R) of 0.570 and weighted average of 14.3%, a difference of 2.4%.
Female Poverty Among 25-34 Year Olds Correlation Summary
| Measurement | Immigrants from Ecuador | Immigrants from Nigeria |
| Minimum | 3.2% | 2.2% |
| Maximum | 28.8% | 100.0% |
| Range | 25.6% | 97.8% |
| Mean | 14.4% | 22.9% |
| Median | 14.3% | 14.2% |
| Interquartile 25% (IQ1) | 11.3% | 9.7% |
| Interquartile 75% (IQ3) | 17.9% | 22.0% |
| Interquartile Range (IQR) | 6.5% | 12.3% |
| Standard Deviation (Sample) | 5.2% | 24.4% |
| Standard Deviation (Population) | 5.1% | 24.1% |
Demographics Similar to Immigrants from Ecuador and Immigrants from Nigeria by Female Poverty Among 25-34 Year Olds
In terms of female poverty among 25-34 year olds, the demographic groups most similar to Immigrants from Ecuador are White/Caucasian (14.7%, a difference of 0.18%), Delaware (14.6%, a difference of 0.31%), Spaniard (14.6%, a difference of 0.36%), Spanish (14.6%, a difference of 0.49%), and Vietnamese (14.6%, a difference of 0.59%). Similarly, the demographic groups most similar to Immigrants from Nigeria are French (14.3%, a difference of 0.020%), Puget Sound Salish (14.3%, a difference of 0.12%), French Canadian (14.3%, a difference of 0.25%), Spanish American Indian (14.3%, a difference of 0.25%), and Immigrants from Thailand (14.3%, a difference of 0.36%).
| Demographics | Rating | Rank | Female Poverty Among 25-34 Year Olds |
| Puget Sound Salish | 6.5 /100 | #213 | Tragic 14.3% |
| French | 6.2 /100 | #214 | Tragic 14.3% |
| Immigrants | Nigeria | 6.2 /100 | #215 | Tragic 14.3% |
| French Canadians | 5.5 /100 | #216 | Tragic 14.3% |
| Spanish American Indians | 5.5 /100 | #217 | Tragic 14.3% |
| Immigrants | Thailand | 5.2 /100 | #218 | Tragic 14.3% |
| Ecuadorians | 5.2 /100 | #219 | Tragic 14.3% |
| Ghanaians | 4.8 /100 | #220 | Tragic 14.4% |
| Sudanese | 4.4 /100 | #221 | Tragic 14.4% |
| Immigrants | Portugal | 4.3 /100 | #222 | Tragic 14.4% |
| Nigerians | 4.2 /100 | #223 | Tragic 14.4% |
| Immigrants | Sudan | 4.0 /100 | #224 | Tragic 14.4% |
| Immigrants | Barbados | 3.4 /100 | #225 | Tragic 14.5% |
| Nicaraguans | 3.3 /100 | #226 | Tragic 14.5% |
| Celtics | 2.8 /100 | #227 | Tragic 14.5% |
| Vietnamese | 2.6 /100 | #228 | Tragic 14.6% |
| Spanish | 2.5 /100 | #229 | Tragic 14.6% |
| Spaniards | 2.3 /100 | #230 | Tragic 14.6% |
| Delaware | 2.3 /100 | #231 | Tragic 14.6% |
| Immigrants | Ecuador | 1.9 /100 | #232 | Tragic 14.6% |
| Whites/Caucasians | 1.8 /100 | #233 | Tragic 14.7% |