Immigrants from Eastern Asia vs Immigrants from India Female Poverty Among 18-24 Year Olds
COMPARE
Immigrants from Eastern Asia
Immigrants from India
Female Poverty Among 18-24 Year Olds
Female Poverty Among 18-24 Year Olds Comparison
Immigrants from Eastern Asia
Immigrants from India
19.8%
FEMALE POVERTY AMONG 18-24 YEAR OLDS
79.7/ 100
METRIC RATING
151st/ 347
METRIC RANK
16.4%
FEMALE POVERTY AMONG 18-24 YEAR OLDS
100.0/ 100
METRIC RATING
4th/ 347
METRIC RANK
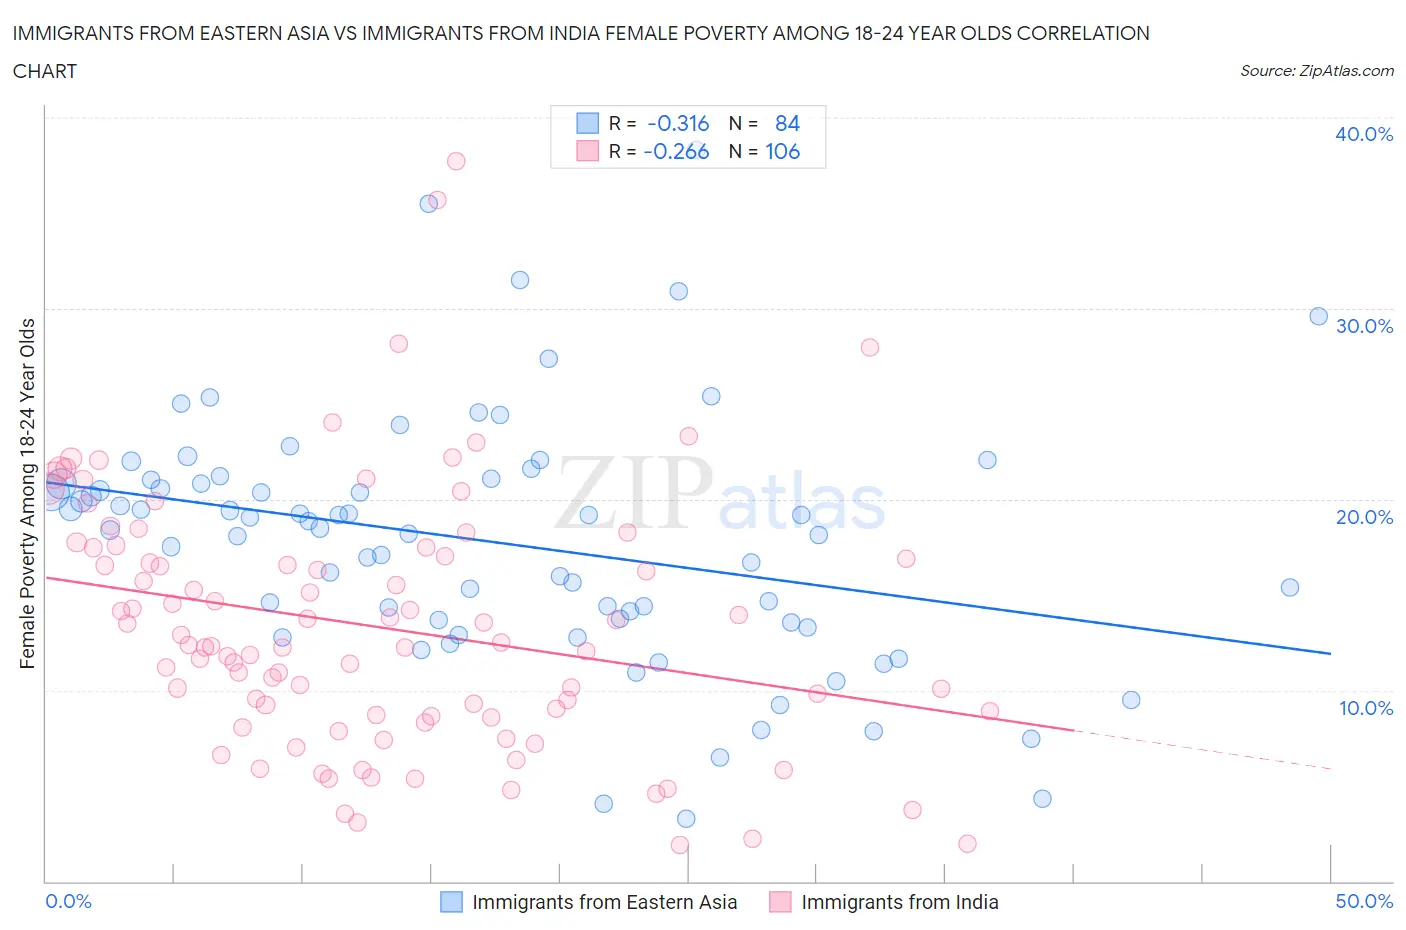
Immigrants from Eastern Asia vs Immigrants from India Female Poverty Among 18-24 Year Olds Correlation Chart
The statistical analysis conducted on geographies consisting of 480,513,058 people shows a mild negative correlation between the proportion of Immigrants from Eastern Asia and poverty level among females between the ages 18 and 24 in the United States with a correlation coefficient (R) of -0.316 and weighted average of 19.8%. Similarly, the statistical analysis conducted on geographies consisting of 421,547,440 people shows a weak negative correlation between the proportion of Immigrants from India and poverty level among females between the ages 18 and 24 in the United States with a correlation coefficient (R) of -0.266 and weighted average of 16.4%, a difference of 20.3%.
Female Poverty Among 18-24 Year Olds Correlation Summary
| Measurement | Immigrants from Eastern Asia | Immigrants from India |
| Minimum | 3.2% | 1.9% |
| Maximum | 38.3% | 37.7% |
| Range | 35.1% | 35.8% |
| Mean | 17.8% | 13.3% |
| Median | 18.4% | 12.3% |
| Interquartile 25% (IQ1) | 13.6% | 8.6% |
| Interquartile 75% (IQ3) | 20.9% | 17.5% |
| Interquartile Range (IQR) | 7.3% | 8.8% |
| Standard Deviation (Sample) | 6.5% | 6.7% |
| Standard Deviation (Population) | 6.5% | 6.7% |
Similar Demographics by Female Poverty Among 18-24 Year Olds
Demographics Similar to Immigrants from Eastern Asia by Female Poverty Among 18-24 Year Olds
In terms of female poverty among 18-24 year olds, the demographic groups most similar to Immigrants from Eastern Asia are Syrian (19.8%, a difference of 0.040%), Yugoslavian (19.8%, a difference of 0.050%), Immigrants from Oceania (19.7%, a difference of 0.12%), Immigrants from Japan (19.8%, a difference of 0.12%), and Immigrants from Latin America (19.7%, a difference of 0.13%).
| Demographics | Rating | Rank | Female Poverty Among 18-24 Year Olds |
| Immigrants | Northern Africa | 84.1 /100 | #144 | Excellent 19.7% |
| Canadians | 83.8 /100 | #145 | Excellent 19.7% |
| Immigrants | Bosnia and Herzegovina | 83.6 /100 | #146 | Excellent 19.7% |
| Immigrants | Austria | 83.1 /100 | #147 | Excellent 19.7% |
| Immigrants | Latin America | 81.3 /100 | #148 | Excellent 19.7% |
| Immigrants | Oceania | 81.2 /100 | #149 | Excellent 19.7% |
| Syrians | 80.2 /100 | #150 | Excellent 19.8% |
| Immigrants | Eastern Asia | 79.7 /100 | #151 | Good 19.8% |
| Yugoslavians | 79.0 /100 | #152 | Good 19.8% |
| Immigrants | Japan | 78.1 /100 | #153 | Good 19.8% |
| Immigrants | Zimbabwe | 76.7 /100 | #154 | Good 19.8% |
| Hungarians | 76.6 /100 | #155 | Good 19.8% |
| Immigrants | Belgium | 76.4 /100 | #156 | Good 19.8% |
| Danes | 75.5 /100 | #157 | Good 19.8% |
| Immigrants | Lebanon | 75.3 /100 | #158 | Good 19.8% |
Demographics Similar to Immigrants from India by Female Poverty Among 18-24 Year Olds
In terms of female poverty among 18-24 year olds, the demographic groups most similar to Immigrants from India are Immigrants from Cuba (16.4%, a difference of 0.030%), Immigrants from Portugal (16.5%, a difference of 0.72%), Immigrants from Philippines (16.7%, a difference of 1.5%), Immigrants from the Azores (16.7%, a difference of 1.5%), and Chinese (16.2%, a difference of 1.7%).
| Demographics | Rating | Rank | Female Poverty Among 18-24 Year Olds |
| Assyrians/Chaldeans/Syriacs | 100.0 /100 | #1 | Exceptional 13.7% |
| Chinese | 100.0 /100 | #2 | Exceptional 16.2% |
| Immigrants | Cuba | 100.0 /100 | #3 | Exceptional 16.4% |
| Immigrants | India | 100.0 /100 | #4 | Exceptional 16.4% |
| Immigrants | Portugal | 100.0 /100 | #5 | Exceptional 16.5% |
| Immigrants | Philippines | 100.0 /100 | #6 | Exceptional 16.7% |
| Immigrants | Azores | 100.0 /100 | #7 | Exceptional 16.7% |
| Immigrants | Bolivia | 100.0 /100 | #8 | Exceptional 16.7% |
| Immigrants | Peru | 100.0 /100 | #9 | Exceptional 16.9% |
| Koreans | 100.0 /100 | #10 | Exceptional 16.9% |
| Thais | 100.0 /100 | #11 | Exceptional 17.0% |
| Immigrants | Pakistan | 100.0 /100 | #12 | Exceptional 17.0% |
| Immigrants | Poland | 100.0 /100 | #13 | Exceptional 17.1% |
| Tongans | 100.0 /100 | #14 | Exceptional 17.1% |
| Cubans | 100.0 /100 | #15 | Exceptional 17.2% |