Immigrants from Dominica vs Malaysian Child Poverty Under the Age of 5

COMPARE

Immigrants from Dominica
Race
Ancestry
AfghanAfricanAlaska NativeAlaskan AthabascanAlbanianAleutAlsatianAmericanApacheArabArapahoArgentineanArmenianAssyrian/Chaldean/SyriacAustralianAustrianBahamianBangladeshiBarbadianBasqueBelgianBelizeanBermudanBhutaneseBlackfeetBolivianBrazilianBritishBritish West IndianBulgarianBurmeseCajunCambodianCanadianCape VerdeanCarpatho RusynCelticCentral AmericanCentral American IndianCherokeeCheyenneChickasawChileanChineseChippewaChoctawColombianColvilleComancheCosta RicanCreeCreekCroatianCrowCubanCypriotCzechCzechoslovakianDanishDelawareDominicanDutchDutch West IndianEastern EuropeanEcuadorianEgyptianEnglishEstonianEthiopianEuropeanFijianFilipinoFinnishFrenchFrench American IndianFrench CanadianGermanGerman RussianGhanaianGreekGuamanian/ChamorroGuatemalanGuyaneseHaitianHmongHonduranHopiHoumaHungarianIcelanderIndian (Asian)IndonesianInupiatIranianIraqiIrishIroquoisIsraeliItalianJamaicanJapaneseJordanianKenyanKiowaKoreanLaotianLatvianLebaneseLiberianLithuanianLumbeeLuxembourgerMacedonianMalteseMarshalleseMenomineeMexicanMexican American IndianMongolianMoroccanNative HawaiianNavajoNepaleseNew ZealanderNicaraguanNigerianNorthern EuropeanNorwegianOkinawanOsageOttawaPaiutePakistaniPalestinianPanamanianParaguayanPennsylvania GermanPeruvianPimaPolishPortuguesePotawatomiPuebloPuerto RicanPuget Sound SalishRomanianRussianSalvadoranSamoanScandinavianScotch-IrishScottishSeminoleSenegaleseSerbianShoshoneSierra LeoneanSiouxSlavicSlovakSloveneSomaliSouth AfricanSouth AmericanSouth American IndianSoviet UnionSpaniardSpanishSpanish AmericanSpanish American IndianSri LankanSubsaharan AfricanSudaneseSwedishSwissSyrianTaiwaneseThaiTlingit-HaidaTohono O'OdhamTonganTrinidadian and TobagonianTsimshianTurkishU.S. Virgin IslanderUgandanUkrainianUruguayanUteVenezuelanVietnameseWelshWest IndianYakamaYaquiYugoslavianYumanYup'ikZimbabwean
Immigration
NonimmigrantsImmigrantsAfghanistanAfricaAlbaniaArgentinaArmeniaAsiaAustraliaAustriaBahamasBangladeshBarbadosBelarusBelgiumBelizeBoliviaBosnia and HerzegovinaBrazilBulgariaBurma/MyanmarCabo VerdeCambodiaCameroonCanadaCaribbeanCentral AmericaChileChinaColombiaCongoCosta RicaCroatiaCubaCzechoslovakiaDenmarkDominicaDominican RepublicEastern AfricaEastern AsiaEastern EuropeEcuadorEgyptEl SalvadorEnglandEritreaEthiopiaEuropeFijiFranceGermanyGhanaGreeceGrenadaGuatemalaGuyanaHaitiHondurasHong KongHungaryIndiaIndonesiaIranIraqIrelandIsraelItalyJamaicaJapanJordanKazakhstanKenyaKoreaKuwaitLaosLatin AmericaLatviaLebanonLiberiaLithuaniaMalaysiaMexicoMicronesiaMiddle AfricaMoldovaMoroccoNepalNetherlandsNicaraguaNigeriaNorth AmericaNorth MacedoniaNorthern AfricaNorthern EuropeNorwayOceaniaPakistanPanamaPeruPhilippinesPolandPortugalRomaniaRussiaSaudi ArabiaScotlandSenegalSerbiaSierra LeoneSingaporeSomaliaSouth AfricaSouth AmericaSouth Central AsiaSouth Eastern AsiaSouthern EuropeSpainSri LankaSt. Vincent and the GrenadinesSudanSwedenSwitzerlandSyriaTaiwanThailandTrinidad and TobagoTurkeyUgandaUkraineUruguayUzbekistanVenezuelaVietnamWest IndiesWestern AfricaWestern AsiaWestern EuropeYemenZaireZimbabweAzores
Malaysian
Race
Ancestry
AfghanAfricanAlaska NativeAlaskan AthabascanAlbanianAleutAlsatianAmericanApacheArabArapahoArgentineanArmenianAssyrian/Chaldean/SyriacAustralianAustrianBahamianBangladeshiBarbadianBasqueBelgianBelizeanBermudanBhutaneseBlackfeetBolivianBrazilianBritishBritish West IndianBulgarianBurmeseCajunCambodianCanadianCape VerdeanCarpatho RusynCelticCentral AmericanCentral American IndianCherokeeCheyenneChickasawChileanChineseChippewaChoctawColombianColvilleComancheCosta RicanCreeCreekCroatianCrowCubanCypriotCzechCzechoslovakianDanishDelawareDominicanDutchDutch West IndianEastern EuropeanEcuadorianEgyptianEnglishEstonianEthiopianEuropeanFijianFilipinoFinnishFrenchFrench American IndianFrench CanadianGermanGerman RussianGhanaianGreekGuamanian/ChamorroGuatemalanGuyaneseHaitianHmongHonduranHopiHoumaHungarianIcelanderIndian (Asian)IndonesianInupiatIranianIraqiIrishIroquoisIsraeliItalianJamaicanJapaneseJordanianKenyanKiowaKoreanLaotianLatvianLebaneseLiberianLithuanianLumbeeLuxembourgerMacedonianMalaysianMalteseMarshalleseMenomineeMexicanMexican American IndianMongolianMoroccanNative HawaiianNavajoNepaleseNew ZealanderNicaraguanNigerianNorthern EuropeanNorwegianOkinawanOsageOttawaPaiutePakistaniPalestinianPanamanianParaguayanPennsylvania GermanPeruvianPimaPolishPortuguesePotawatomiPuebloPuerto RicanPuget Sound SalishRomanianRussianSalvadoranSamoanScandinavianScotch-IrishScottishSeminoleSenegaleseSerbianShoshoneSierra LeoneanSiouxSlavicSlovakSloveneSomaliSouth AfricanSouth AmericanSouth American IndianSoviet UnionSpaniardSpanishSpanish AmericanSpanish American IndianSri LankanSubsaharan AfricanSudaneseSwedishSwissSyrianTaiwaneseThaiTlingit-HaidaTohono O'OdhamTonganTrinidadian and TobagonianTsimshianTurkishU.S. Virgin IslanderUgandanUkrainianUruguayanUteVenezuelanVietnameseWelshWest IndianYakamaYaquiYugoslavianYumanYup'ikZimbabwean
Immigration
NonimmigrantsImmigrantsAfghanistanAfricaAlbaniaArgentinaArmeniaAsiaAustraliaAustriaBahamasBangladeshBarbadosBelarusBelgiumBelizeBoliviaBosnia and HerzegovinaBrazilBulgariaBurma/MyanmarCabo VerdeCambodiaCameroonCanadaCaribbeanCentral AmericaChileChinaColombiaCongoCosta RicaCroatiaCubaCzechoslovakiaDenmarkDominican RepublicEastern AfricaEastern AsiaEastern EuropeEcuadorEgyptEl SalvadorEnglandEritreaEthiopiaEuropeFijiFranceGermanyGhanaGreeceGrenadaGuatemalaGuyanaHaitiHondurasHong KongHungaryIndiaIndonesiaIranIraqIrelandIsraelItalyJamaicaJapanJordanKazakhstanKenyaKoreaKuwaitLaosLatin AmericaLatviaLebanonLiberiaLithuaniaMalaysiaMexicoMicronesiaMiddle AfricaMoldovaMoroccoNepalNetherlandsNicaraguaNigeriaNorth AmericaNorth MacedoniaNorthern AfricaNorthern EuropeNorwayOceaniaPakistanPanamaPeruPhilippinesPolandPortugalRomaniaRussiaSaudi ArabiaScotlandSenegalSerbiaSierra LeoneSingaporeSomaliaSouth AfricaSouth AmericaSouth Central AsiaSouth Eastern AsiaSouthern EuropeSpainSri LankaSt. Vincent and the GrenadinesSudanSwedenSwitzerlandSyriaTaiwanThailandTrinidad and TobagoTurkeyUgandaUkraineUruguayUzbekistanVenezuelaVietnamWest IndiesWestern AfricaWestern AsiaWestern EuropeYemenZaireZimbabweAzores
Child Poverty Under the Age of 5
Income
Poverty
Unemployment
Labor Participation
Family Structure
Vehicle Availability
Education Level
Disability

Child Poverty Under the Age of 5 Comparison

Immigrants from Dominica

Malaysians

Tragic
Tragic
22.7%
CHILD POVERTY UNDER THE AGE OF 5
0.0/ 100
METRIC RATING
308th/ 347
METRIC RANK
18.4%
CHILD POVERTY UNDER THE AGE OF 5
6.5/ 100
METRIC RATING
214th/ 347
METRIC RANK

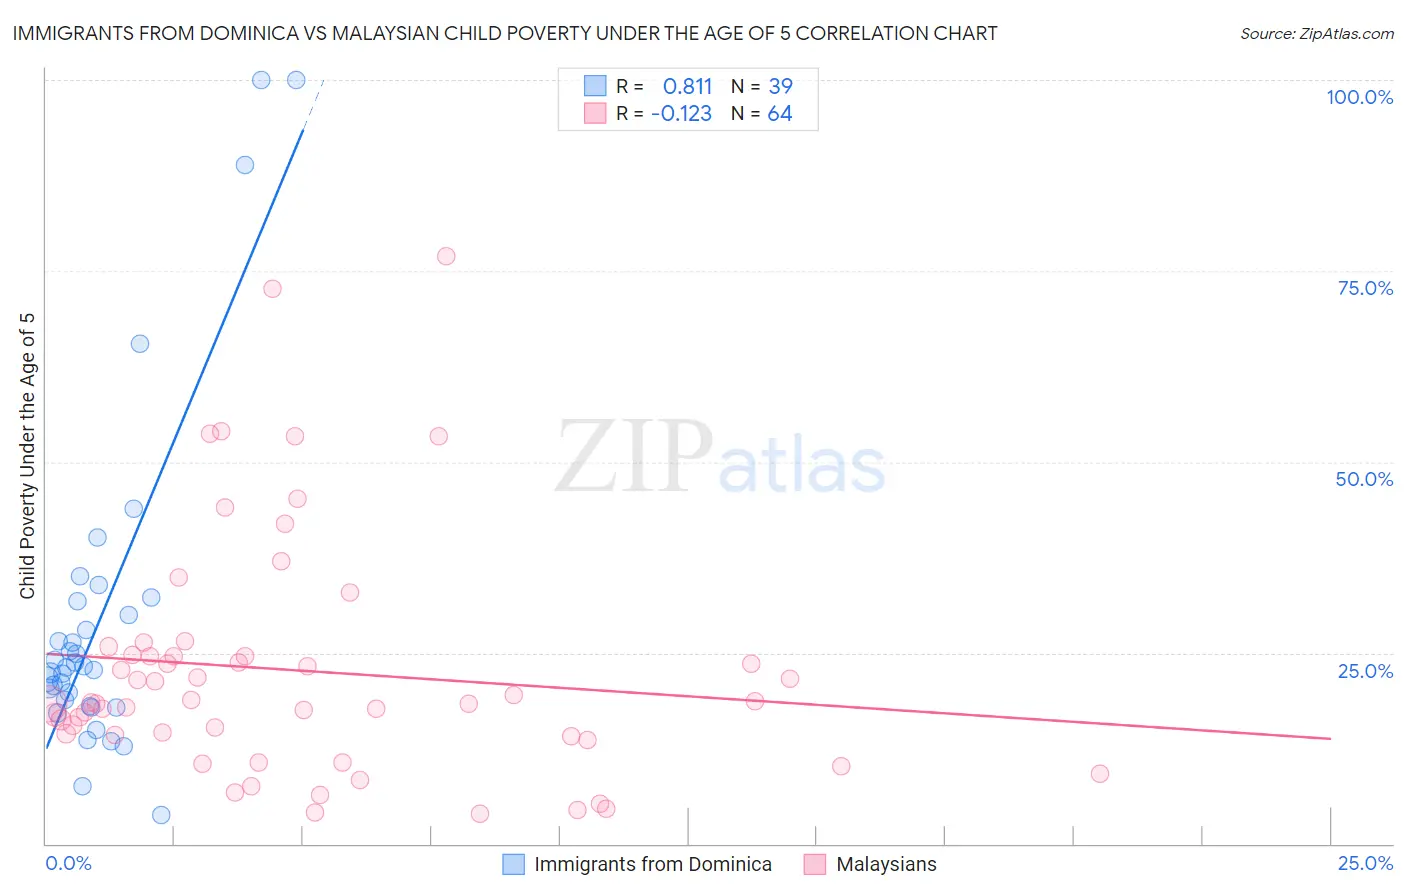
Immigrants from Dominica vs Malaysian Child Poverty Under the Age of 5 Correlation Chart

The statistical analysis conducted on geographies consisting of 83,100,488 people shows a very strong positive correlation between the proportion of Immigrants from Dominica and poverty level among children under the age of 5 in the United States with a correlation coefficient (R) of 0.811 and weighted average of 22.7%. Similarly, the statistical analysis conducted on geographies consisting of 221,749,589 people shows a poor negative correlation between the proportion of Malaysians and poverty level among children under the age of 5 in the United States with a correlation coefficient (R) of -0.123 and weighted average of 18.4%, a difference of 23.2%.
Immigrants from Dominica vs Malaysian Child Poverty Under the Age of 5

Child Poverty Under the Age of 5 Correlation Summary

MeasurementImmigrants from DominicaMalaysian
Minimum3.8%4.0%
Maximum100.0%76.9%
Range96.2%73.0%
Mean29.6%22.7%
Median23.1%18.5%
Interquartile 25% (IQ1)17.9%14.1%
Interquartile 75% (IQ3)31.8%24.6%
Interquartile Range (IQR)13.9%10.5%
Standard Deviation (Sample)22.2%15.6%
Standard Deviation (Population)21.9%15.5%

Similar Demographics by Child Poverty Under the Age of 5

Demographics Similar to Immigrants from Dominica by Child Poverty Under the Age of 5

In terms of child poverty under the age of 5, the demographic groups most similar to Immigrants from Dominica are Immigrants from Bahamas (22.7%, a difference of 0.040%), Houma (22.7%, a difference of 0.14%), African (22.8%, a difference of 0.55%), Seminole (22.8%, a difference of 0.59%), and Honduran (23.0%, a difference of 1.2%).
DemographicsRating | RankChild Poverty Under the Age of 5
Immigrants | Central America
0.0
/100
|
#301
Tragic
22.0%
Iroquois
0.0
/100
|
#302
Tragic
22.0%
Inupiat
0.0
/100
|
#303
Tragic
22.0%
Immigrants | Guatemala
0.0
/100
|
#304
Tragic
22.0%
Immigrants | Mexico
0.0
/100
|
#305
Tragic
22.2%
Indonesians
0.0
/100
|
#306
Tragic
22.3%
Immigrants | Bahamas
0.0
/100
|
#307
Tragic
22.7%
Immigrants | Dominica
0.0
/100
|
#308
Tragic
22.7%
Houma
0.0
/100
|
#309
Tragic
22.7%
Africans
0.0
/100
|
#310
Tragic
22.8%
Seminole
0.0
/100
|
#311
Tragic
22.8%
Hondurans
0.0
/100
|
#312
Tragic
23.0%
Bahamians
0.0
/100
|
#313
Tragic
23.0%
U.S. Virgin Islanders
0.0
/100
|
#314
Tragic
23.0%
Arapaho
0.0
/100
|
#315
Tragic
23.1%

Demographics Similar to Malaysians by Child Poverty Under the Age of 5

In terms of child poverty under the age of 5, the demographic groups most similar to Malaysians are Immigrants from Panama (18.5%, a difference of 0.20%), Hmong (18.5%, a difference of 0.66%), Immigrants from Thailand (18.3%, a difference of 0.76%), Nepalese (18.3%, a difference of 0.78%), and Immigrants from Africa (18.6%, a difference of 0.87%).
DemographicsRating | RankChild Poverty Under the Age of 5
Immigrants | Immigrants
9.9
/100
|
#207
Tragic
18.2%
Scotch-Irish
9.8
/100
|
#208
Tragic
18.2%
Spanish
9.8
/100
|
#209
Tragic
18.2%
Panamanians
9.7
/100
|
#210
Tragic
18.2%
Moroccans
9.4
/100
|
#211
Tragic
18.2%
Nepalese
8.7
/100
|
#212
Tragic
18.3%
Immigrants | Thailand
8.6
/100
|
#213
Tragic
18.3%
Malaysians
6.5
/100
|
#214
Tragic
18.4%
Immigrants | Panama
6.0
/100
|
#215
Tragic
18.5%
Hmong
5.0
/100
|
#216
Tragic
18.5%
Immigrants | Africa
4.6
/100
|
#217
Tragic
18.6%
Delaware
3.4
/100
|
#218
Tragic
18.7%
German Russians
3.0
/100
|
#219
Tragic
18.8%
Immigrants | Azores
2.6
/100
|
#220
Tragic
18.9%
Immigrants | Nigeria
2.1
/100
|
#221
Tragic
19.0%