Immigrants from Dominican Republic vs Immigrants from North America Family Poverty
COMPARE
Immigrants from Dominican Republic
Immigrants from North America
Family Poverty
Family Poverty Comparison
Immigrants from Dominican Republic
Immigrants from North America
14.4%
FAMILY POVERTY
0.0/ 100
METRIC RATING
333rd/ 347
METRIC RANK
7.9%
FAMILY POVERTY
97.9/ 100
METRIC RATING
78th/ 347
METRIC RANK
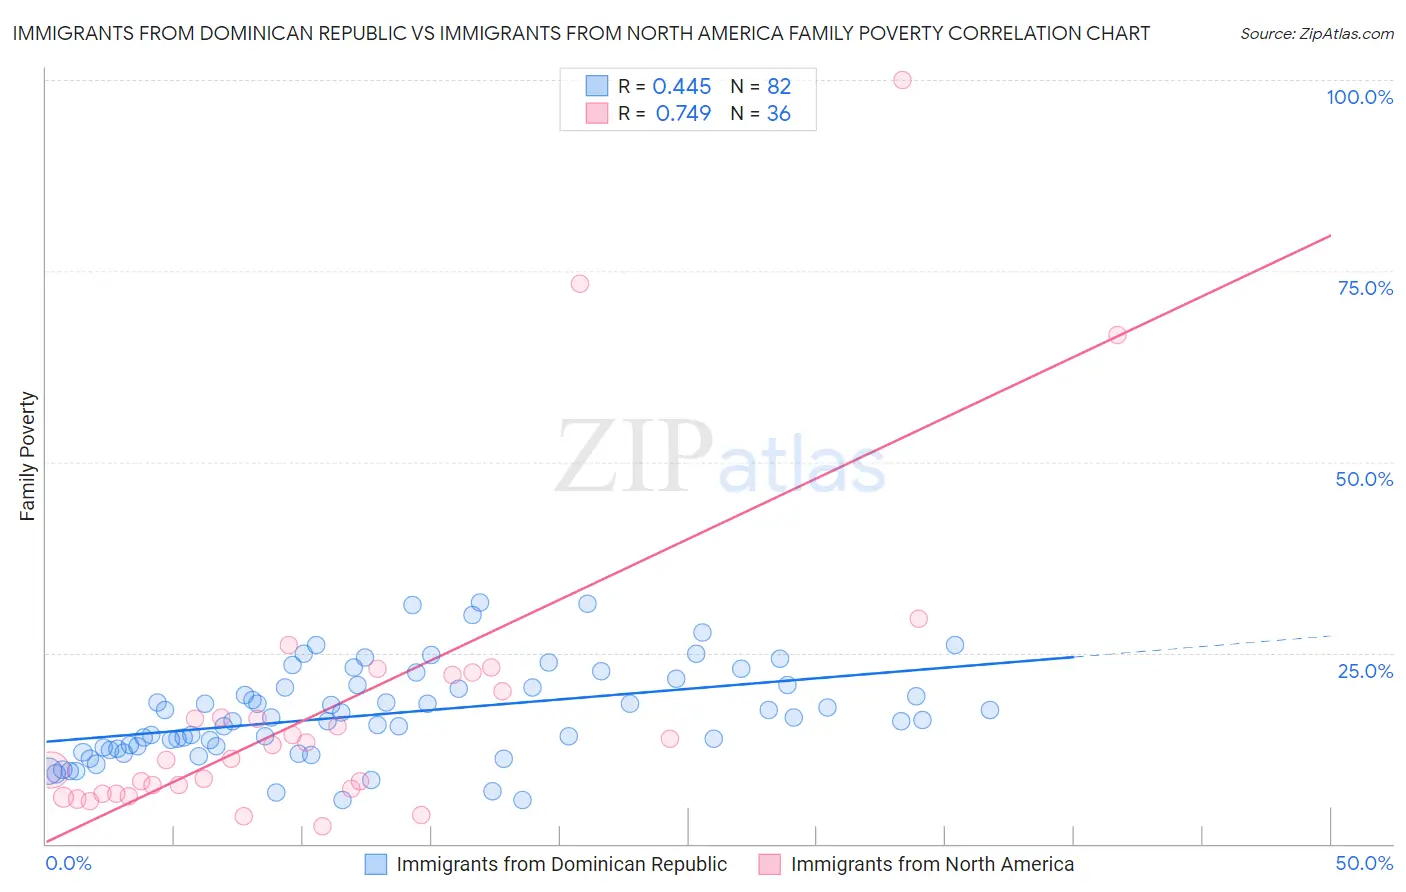
Immigrants from Dominican Republic vs Immigrants from North America Family Poverty Correlation Chart
The statistical analysis conducted on geographies consisting of 274,499,505 people shows a moderate positive correlation between the proportion of Immigrants from Dominican Republic and poverty level among families in the United States with a correlation coefficient (R) of 0.445 and weighted average of 14.4%. Similarly, the statistical analysis conducted on geographies consisting of 460,351,855 people shows a strong positive correlation between the proportion of Immigrants from North America and poverty level among families in the United States with a correlation coefficient (R) of 0.749 and weighted average of 7.9%, a difference of 83.3%.
Family Poverty Correlation Summary
| Measurement | Immigrants from Dominican Republic | Immigrants from North America |
| Minimum | 5.8% | 2.3% |
| Maximum | 31.5% | 100.0% |
| Range | 25.8% | 97.7% |
| Mean | 17.0% | 18.1% |
| Median | 16.3% | 12.1% |
| Interquartile 25% (IQ1) | 12.5% | 6.9% |
| Interquartile 75% (IQ3) | 20.7% | 21.0% |
| Interquartile Range (IQR) | 8.2% | 14.2% |
| Standard Deviation (Sample) | 6.1% | 20.6% |
| Standard Deviation (Population) | 6.0% | 20.3% |
Similar Demographics by Family Poverty
Demographics Similar to Immigrants from Dominican Republic by Family Poverty
In terms of family poverty, the demographic groups most similar to Immigrants from Dominican Republic are Dominican (14.3%, a difference of 0.63%), Cheyenne (14.3%, a difference of 1.1%), Native/Alaskan (14.3%, a difference of 1.2%), Houma (14.6%, a difference of 1.3%), and Apache (14.7%, a difference of 2.1%).
| Demographics | Rating | Rank | Family Poverty |
| Colville | 0.0 /100 | #326 | Tragic 13.0% |
| Yakama | 0.0 /100 | #327 | Tragic 13.1% |
| Central American Indians | 0.0 /100 | #328 | Tragic 13.3% |
| Blacks/African Americans | 0.0 /100 | #329 | Tragic 13.3% |
| Natives/Alaskans | 0.0 /100 | #330 | Tragic 14.3% |
| Cheyenne | 0.0 /100 | #331 | Tragic 14.3% |
| Dominicans | 0.0 /100 | #332 | Tragic 14.3% |
| Immigrants | Dominican Republic | 0.0 /100 | #333 | Tragic 14.4% |
| Houma | 0.0 /100 | #334 | Tragic 14.6% |
| Apache | 0.0 /100 | #335 | Tragic 14.7% |
| Sioux | 0.0 /100 | #336 | Tragic 15.9% |
| Hopi | 0.0 /100 | #337 | Tragic 15.9% |
| Crow | 0.0 /100 | #338 | Tragic 16.1% |
| Yuman | 0.0 /100 | #339 | Tragic 16.6% |
| Pueblo | 0.0 /100 | #340 | Tragic 17.0% |
Demographics Similar to Immigrants from North America by Family Poverty
In terms of family poverty, the demographic groups most similar to Immigrants from North America are Immigrants from Europe (7.9%, a difference of 0.080%), Immigrants from Latvia (7.9%, a difference of 0.12%), Ukrainian (7.9%, a difference of 0.12%), English (7.9%, a difference of 0.14%), and Irish (7.9%, a difference of 0.15%).
| Demographics | Rating | Rank | Family Poverty |
| Cambodians | 98.2 /100 | #71 | Exceptional 7.8% |
| Immigrants | Romania | 98.2 /100 | #72 | Exceptional 7.8% |
| Austrians | 98.2 /100 | #73 | Exceptional 7.8% |
| Immigrants | China | 98.1 /100 | #74 | Exceptional 7.8% |
| Immigrants | Croatia | 98.1 /100 | #75 | Exceptional 7.8% |
| Immigrants | Latvia | 98.0 /100 | #76 | Exceptional 7.9% |
| Ukrainians | 98.0 /100 | #77 | Exceptional 7.9% |
| Immigrants | North America | 97.9 /100 | #78 | Exceptional 7.9% |
| Immigrants | Europe | 97.8 /100 | #79 | Exceptional 7.9% |
| English | 97.8 /100 | #80 | Exceptional 7.9% |
| Irish | 97.8 /100 | #81 | Exceptional 7.9% |
| Immigrants | Poland | 97.8 /100 | #82 | Exceptional 7.9% |
| Slovaks | 97.7 /100 | #83 | Exceptional 7.9% |
| British | 97.5 /100 | #84 | Exceptional 7.9% |
| Immigrants | Asia | 97.4 /100 | #85 | Exceptional 7.9% |