Immigrants from Dominica vs Bahamian Seniors Poverty Over the Age of 65
COMPARE
Immigrants from Dominica
Bahamian
Seniors Poverty Over the Age of 65
Seniors Poverty Over the Age of 65 Comparison
Immigrants from Dominica
Bahamians
15.5%
SENIORS POVERTY OVER THE AGE OF 65
0.0/ 100
METRIC RATING
329th/ 347
METRIC RANK
14.2%
SENIORS POVERTY OVER THE AGE OF 65
0.0/ 100
METRIC RATING
310th/ 347
METRIC RANK
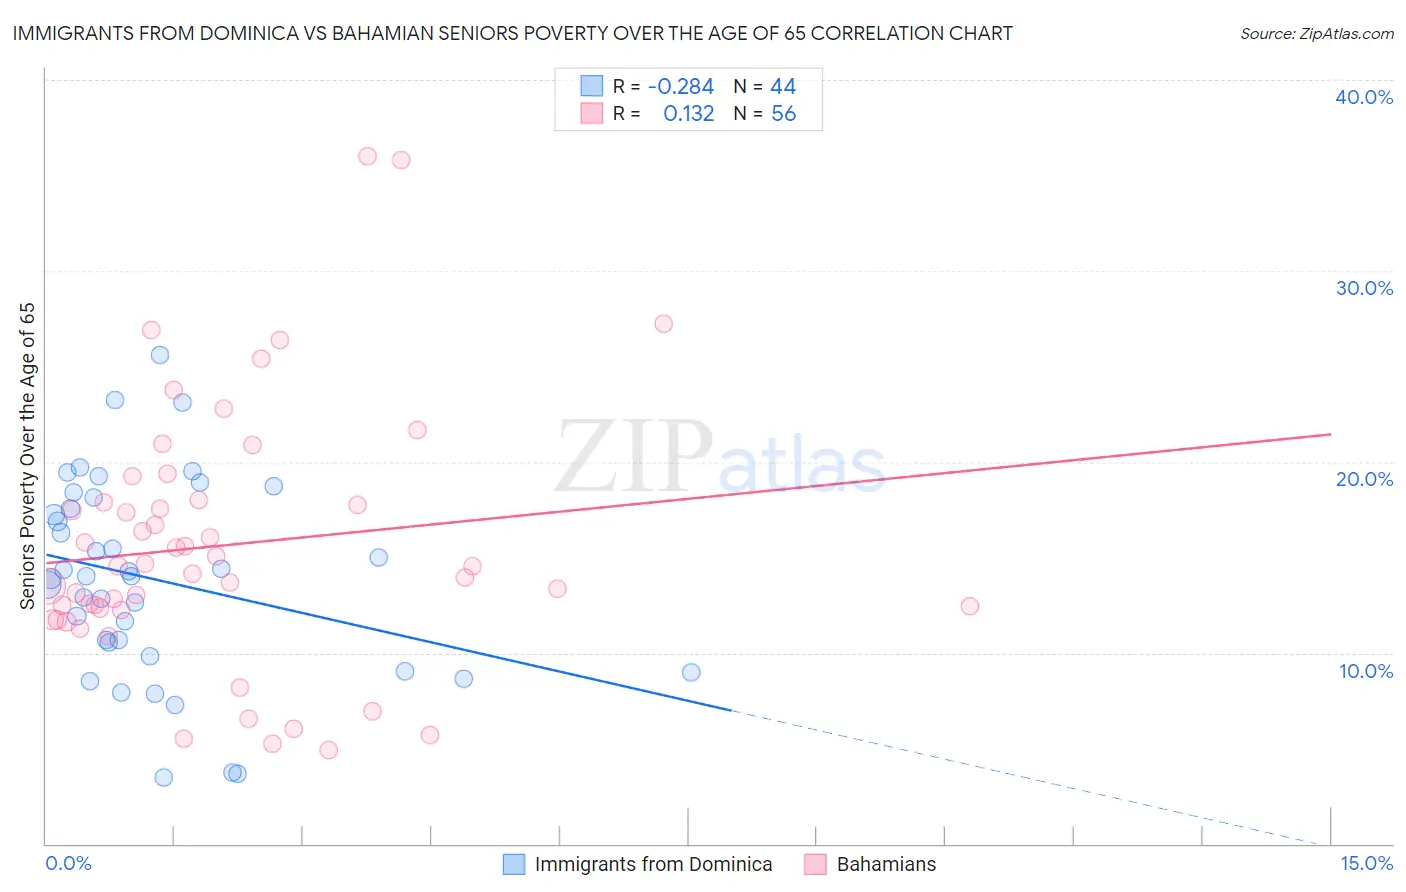
Immigrants from Dominica vs Bahamian Seniors Poverty Over the Age of 65 Correlation Chart
The statistical analysis conducted on geographies consisting of 83,717,367 people shows a weak negative correlation between the proportion of Immigrants from Dominica and poverty level among seniors over the age of 65 in the United States with a correlation coefficient (R) of -0.284 and weighted average of 15.5%. Similarly, the statistical analysis conducted on geographies consisting of 112,479,846 people shows a poor positive correlation between the proportion of Bahamians and poverty level among seniors over the age of 65 in the United States with a correlation coefficient (R) of 0.132 and weighted average of 14.2%, a difference of 8.7%.
Seniors Poverty Over the Age of 65 Correlation Summary
| Measurement | Immigrants from Dominica | Bahamian |
| Minimum | 3.4% | 4.9% |
| Maximum | 25.6% | 36.0% |
| Range | 22.1% | 31.1% |
| Mean | 13.8% | 15.6% |
| Median | 14.0% | 14.5% |
| Interquartile 25% (IQ1) | 10.2% | 12.3% |
| Interquartile 75% (IQ3) | 17.8% | 18.0% |
| Interquartile Range (IQR) | 7.6% | 5.7% |
| Standard Deviation (Sample) | 5.2% | 6.7% |
| Standard Deviation (Population) | 5.1% | 6.7% |
Demographics Similar to Immigrants from Dominica and Bahamians by Seniors Poverty Over the Age of 65
In terms of seniors poverty over the age of 65, the demographic groups most similar to Immigrants from Dominica are Sioux (15.3%, a difference of 1.1%), Crow (15.2%, a difference of 1.6%), Immigrants from Armenia (15.2%, a difference of 1.9%), Central American Indian (15.1%, a difference of 2.5%), and Nicaraguan (15.0%, a difference of 3.1%). Similarly, the demographic groups most similar to Bahamians are Native/Alaskan (14.2%, a difference of 0.010%), Honduran (14.2%, a difference of 0.26%), Hispanic or Latino (14.3%, a difference of 0.54%), Barbadian (14.4%, a difference of 0.92%), and Guyanese (14.4%, a difference of 1.3%).
| Demographics | Rating | Rank | Seniors Poverty Over the Age of 65 |
| Hondurans | 0.0 /100 | #309 | Tragic 14.2% |
| Bahamians | 0.0 /100 | #310 | Tragic 14.2% |
| Natives/Alaskans | 0.0 /100 | #311 | Tragic 14.2% |
| Hispanics or Latinos | 0.0 /100 | #312 | Tragic 14.3% |
| Barbadians | 0.0 /100 | #313 | Tragic 14.4% |
| Guyanese | 0.0 /100 | #314 | Tragic 14.4% |
| Immigrants | Ecuador | 0.0 /100 | #315 | Tragic 14.4% |
| Immigrants | Guyana | 0.0 /100 | #316 | Tragic 14.5% |
| Haitians | 0.0 /100 | #317 | Tragic 14.5% |
| Immigrants | Honduras | 0.0 /100 | #318 | Tragic 14.5% |
| Cape Verdeans | 0.0 /100 | #319 | Tragic 14.7% |
| Immigrants | Haiti | 0.0 /100 | #320 | Tragic 14.7% |
| Houma | 0.0 /100 | #321 | Tragic 14.7% |
| Immigrants | Barbados | 0.0 /100 | #322 | Tragic 14.8% |
| Yakama | 0.0 /100 | #323 | Tragic 14.8% |
| Nicaraguans | 0.0 /100 | #324 | Tragic 15.0% |
| Central American Indians | 0.0 /100 | #325 | Tragic 15.1% |
| Immigrants | Armenia | 0.0 /100 | #326 | Tragic 15.2% |
| Crow | 0.0 /100 | #327 | Tragic 15.2% |
| Sioux | 0.0 /100 | #328 | Tragic 15.3% |
| Immigrants | Dominica | 0.0 /100 | #329 | Tragic 15.5% |