Chilean vs Bahamian Seniors Poverty Over the Age of 65
COMPARE
Chilean
Bahamian
Seniors Poverty Over the Age of 65
Seniors Poverty Over the Age of 65 Comparison
Chileans
Bahamians
11.2%
SENIORS POVERTY OVER THE AGE OF 65
27.8/ 100
METRIC RATING
194th/ 347
METRIC RANK
14.2%
SENIORS POVERTY OVER THE AGE OF 65
0.0/ 100
METRIC RATING
310th/ 347
METRIC RANK
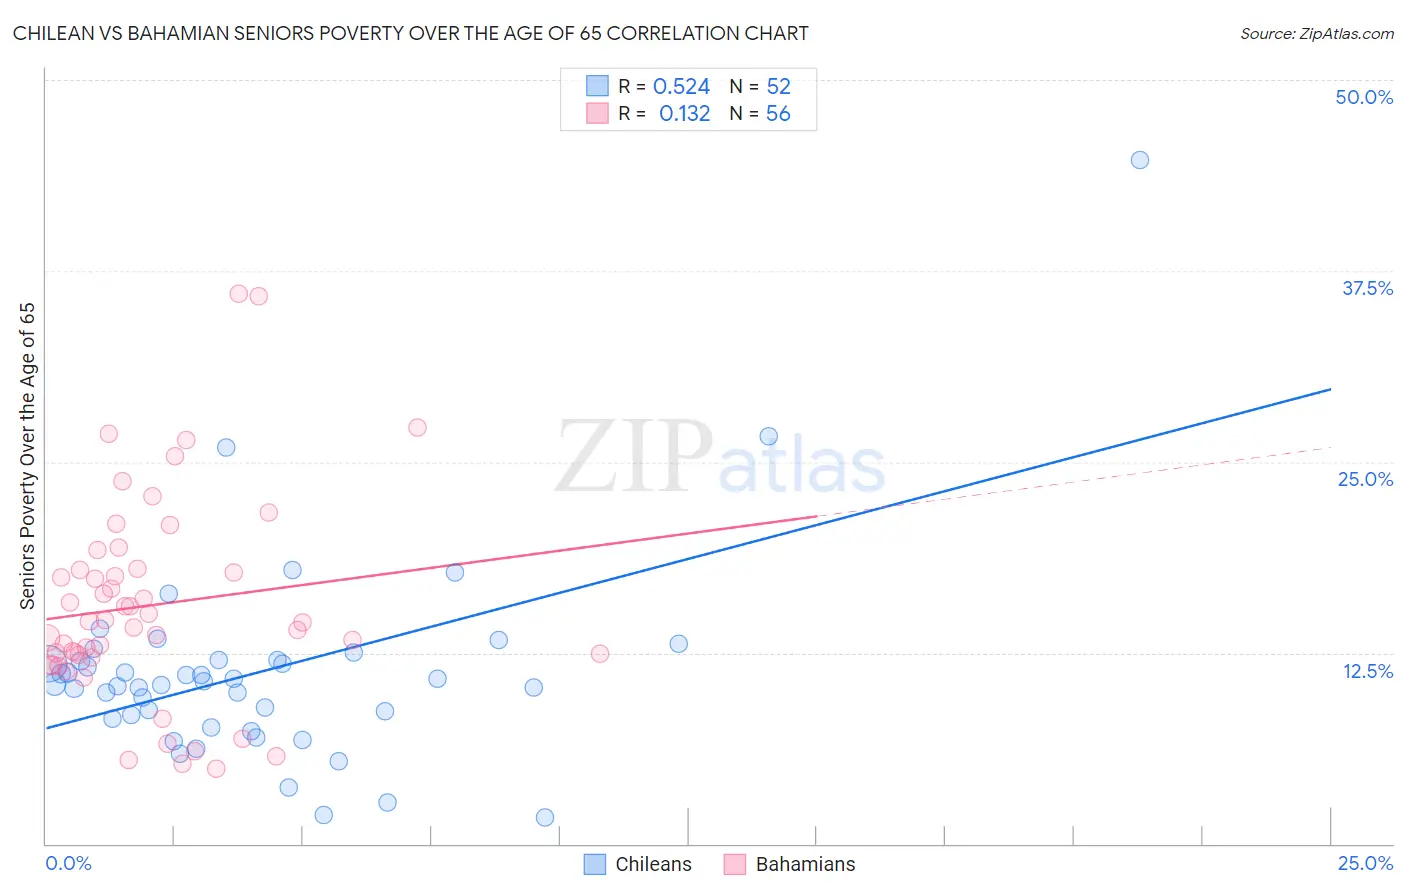
Chilean vs Bahamian Seniors Poverty Over the Age of 65 Correlation Chart
The statistical analysis conducted on geographies consisting of 256,180,753 people shows a substantial positive correlation between the proportion of Chileans and poverty level among seniors over the age of 65 in the United States with a correlation coefficient (R) of 0.524 and weighted average of 11.2%. Similarly, the statistical analysis conducted on geographies consisting of 112,479,846 people shows a poor positive correlation between the proportion of Bahamians and poverty level among seniors over the age of 65 in the United States with a correlation coefficient (R) of 0.132 and weighted average of 14.2%, a difference of 27.5%.
Seniors Poverty Over the Age of 65 Correlation Summary
| Measurement | Chilean | Bahamian |
| Minimum | 1.7% | 4.9% |
| Maximum | 44.7% | 36.0% |
| Range | 43.0% | 31.1% |
| Mean | 11.2% | 15.6% |
| Median | 10.5% | 14.5% |
| Interquartile 25% (IQ1) | 8.3% | 12.3% |
| Interquartile 75% (IQ3) | 12.0% | 18.0% |
| Interquartile Range (IQR) | 3.7% | 5.7% |
| Standard Deviation (Sample) | 6.6% | 6.7% |
| Standard Deviation (Population) | 6.6% | 6.7% |
Similar Demographics by Seniors Poverty Over the Age of 65
Demographics Similar to Chileans by Seniors Poverty Over the Age of 65
In terms of seniors poverty over the age of 65, the demographic groups most similar to Chileans are Immigrants from Vietnam (11.2%, a difference of 0.13%), Taiwanese (11.2%, a difference of 0.15%), Immigrants from Southern Europe (11.1%, a difference of 0.24%), Bangladeshi (11.2%, a difference of 0.30%), and Albanian (11.2%, a difference of 0.39%).
| Demographics | Rating | Rank | Seniors Poverty Over the Age of 65 |
| Immigrants | Middle Africa | 37.4 /100 | #187 | Fair 11.1% |
| Immigrants | Hong Kong | 36.3 /100 | #188 | Fair 11.1% |
| Immigrants | Laos | 35.7 /100 | #189 | Fair 11.1% |
| Indians (Asian) | 34.2 /100 | #190 | Fair 11.1% |
| Immigrants | Uganda | 32.2 /100 | #191 | Fair 11.1% |
| Immigrants | Southern Europe | 30.1 /100 | #192 | Fair 11.1% |
| Taiwanese | 29.2 /100 | #193 | Fair 11.2% |
| Chileans | 27.8 /100 | #194 | Fair 11.2% |
| Immigrants | Vietnam | 26.6 /100 | #195 | Fair 11.2% |
| Bangladeshis | 25.2 /100 | #196 | Fair 11.2% |
| Albanians | 24.4 /100 | #197 | Fair 11.2% |
| Immigrants | Burma/Myanmar | 21.3 /100 | #198 | Fair 11.3% |
| Immigrants | Israel | 20.3 /100 | #199 | Fair 11.3% |
| Alsatians | 20.1 /100 | #200 | Fair 11.3% |
| Immigrants | Brazil | 17.8 /100 | #201 | Poor 11.3% |
Demographics Similar to Bahamians by Seniors Poverty Over the Age of 65
In terms of seniors poverty over the age of 65, the demographic groups most similar to Bahamians are Native/Alaskan (14.2%, a difference of 0.010%), Honduran (14.2%, a difference of 0.26%), Trinidadian and Tobagonian (14.2%, a difference of 0.36%), Immigrants from West Indies (14.2%, a difference of 0.43%), and Hispanic or Latino (14.3%, a difference of 0.54%).
| Demographics | Rating | Rank | Seniors Poverty Over the Age of 65 |
| Immigrants | Bangladesh | 0.0 /100 | #303 | Tragic 14.1% |
| West Indians | 0.0 /100 | #304 | Tragic 14.1% |
| Immigrants | Trinidad and Tobago | 0.0 /100 | #305 | Tragic 14.1% |
| Immigrants | Latin America | 0.0 /100 | #306 | Tragic 14.2% |
| Immigrants | West Indies | 0.0 /100 | #307 | Tragic 14.2% |
| Trinidadians and Tobagonians | 0.0 /100 | #308 | Tragic 14.2% |
| Hondurans | 0.0 /100 | #309 | Tragic 14.2% |
| Bahamians | 0.0 /100 | #310 | Tragic 14.2% |
| Natives/Alaskans | 0.0 /100 | #311 | Tragic 14.2% |
| Hispanics or Latinos | 0.0 /100 | #312 | Tragic 14.3% |
| Barbadians | 0.0 /100 | #313 | Tragic 14.4% |
| Guyanese | 0.0 /100 | #314 | Tragic 14.4% |
| Immigrants | Ecuador | 0.0 /100 | #315 | Tragic 14.4% |
| Immigrants | Guyana | 0.0 /100 | #316 | Tragic 14.5% |
| Haitians | 0.0 /100 | #317 | Tragic 14.5% |