Immigrants from Dominica vs Colville Seniors Poverty Over the Age of 65
COMPARE
Immigrants from Dominica
Colville
Seniors Poverty Over the Age of 65
Seniors Poverty Over the Age of 65 Comparison
Immigrants from Dominica
Colville
15.5%
SENIORS POVERTY OVER THE AGE OF 65
0.0/ 100
METRIC RATING
329th/ 347
METRIC RANK
13.5%
SENIORS POVERTY OVER THE AGE OF 65
0.0/ 100
METRIC RATING
284th/ 347
METRIC RANK
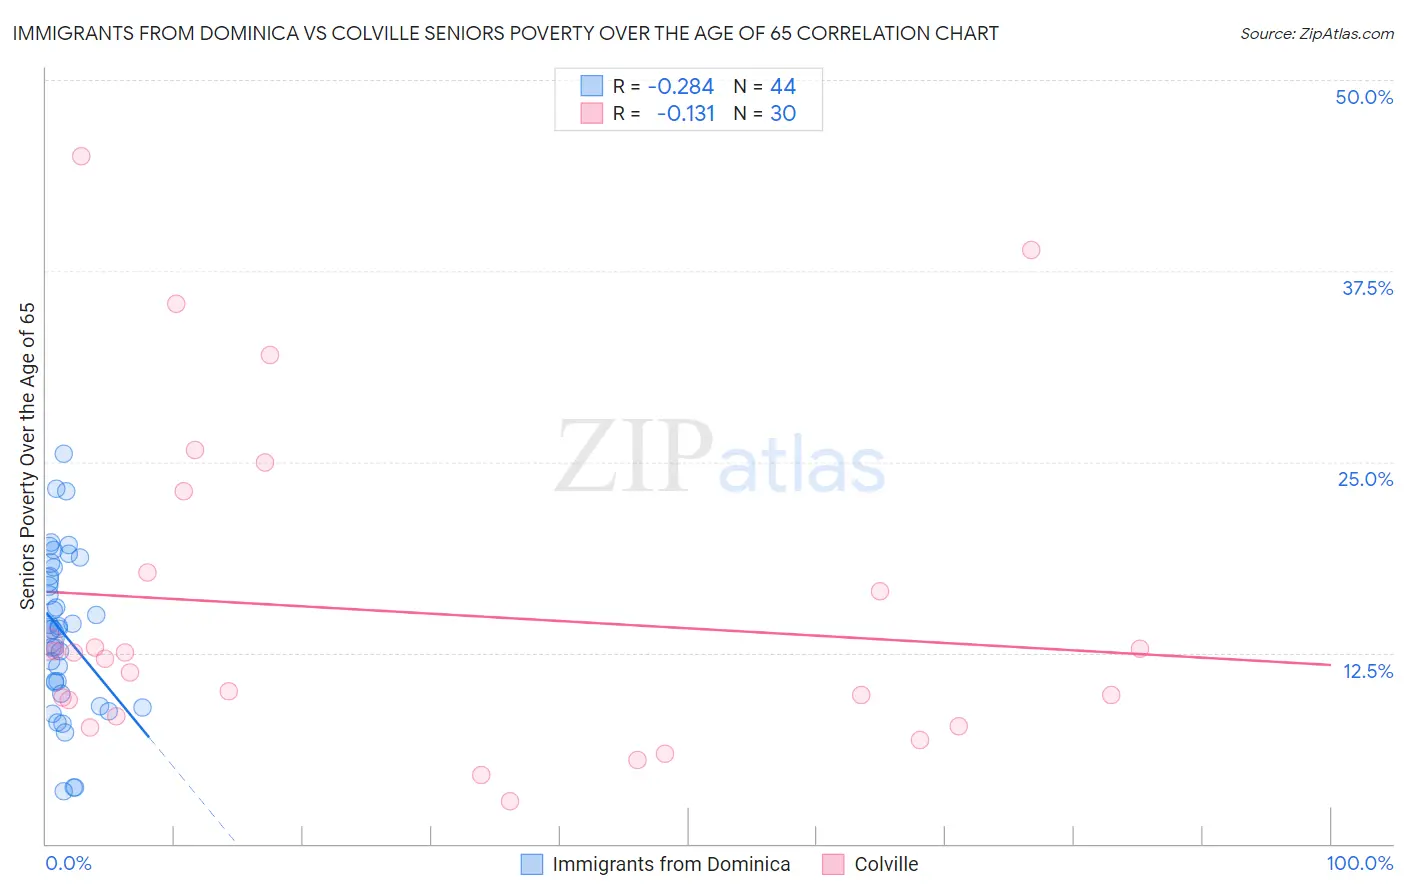
Immigrants from Dominica vs Colville Seniors Poverty Over the Age of 65 Correlation Chart
The statistical analysis conducted on geographies consisting of 83,717,367 people shows a weak negative correlation between the proportion of Immigrants from Dominica and poverty level among seniors over the age of 65 in the United States with a correlation coefficient (R) of -0.284 and weighted average of 15.5%. Similarly, the statistical analysis conducted on geographies consisting of 34,619,145 people shows a poor negative correlation between the proportion of Colville and poverty level among seniors over the age of 65 in the United States with a correlation coefficient (R) of -0.131 and weighted average of 13.5%, a difference of 14.6%.
Seniors Poverty Over the Age of 65 Correlation Summary
| Measurement | Immigrants from Dominica | Colville |
| Minimum | 3.4% | 2.8% |
| Maximum | 25.6% | 45.0% |
| Range | 22.1% | 42.2% |
| Mean | 13.8% | 15.2% |
| Median | 14.0% | 12.3% |
| Interquartile 25% (IQ1) | 10.2% | 8.3% |
| Interquartile 75% (IQ3) | 17.8% | 17.8% |
| Interquartile Range (IQR) | 7.6% | 9.5% |
| Standard Deviation (Sample) | 5.2% | 10.7% |
| Standard Deviation (Population) | 5.1% | 10.5% |
Similar Demographics by Seniors Poverty Over the Age of 65
Demographics Similar to Immigrants from Dominica by Seniors Poverty Over the Age of 65
In terms of seniors poverty over the age of 65, the demographic groups most similar to Immigrants from Dominica are Immigrants from St. Vincent and the Grenadines (15.5%, a difference of 0.30%), British West Indian (15.6%, a difference of 0.81%), Sioux (15.3%, a difference of 1.1%), Crow (15.2%, a difference of 1.6%), and Immigrants from Armenia (15.2%, a difference of 1.9%).
| Demographics | Rating | Rank | Seniors Poverty Over the Age of 65 |
| Immigrants | Barbados | 0.0 /100 | #322 | Tragic 14.8% |
| Yakama | 0.0 /100 | #323 | Tragic 14.8% |
| Nicaraguans | 0.0 /100 | #324 | Tragic 15.0% |
| Central American Indians | 0.0 /100 | #325 | Tragic 15.1% |
| Immigrants | Armenia | 0.0 /100 | #326 | Tragic 15.2% |
| Crow | 0.0 /100 | #327 | Tragic 15.2% |
| Sioux | 0.0 /100 | #328 | Tragic 15.3% |
| Immigrants | Dominica | 0.0 /100 | #329 | Tragic 15.5% |
| Immigrants | St. Vincent and the Grenadines | 0.0 /100 | #330 | Tragic 15.5% |
| British West Indians | 0.0 /100 | #331 | Tragic 15.6% |
| Immigrants | Grenada | 0.0 /100 | #332 | Tragic 15.8% |
| Immigrants | Yemen | 0.0 /100 | #333 | Tragic 15.9% |
| Immigrants | Nicaragua | 0.0 /100 | #334 | Tragic 15.9% |
| Cubans | 0.0 /100 | #335 | Tragic 16.1% |
| Immigrants | Cabo Verde | 0.0 /100 | #336 | Tragic 16.2% |
Demographics Similar to Colville by Seniors Poverty Over the Age of 65
In terms of seniors poverty over the age of 65, the demographic groups most similar to Colville are Guatemalan (13.5%, a difference of 0.23%), Immigrants from Senegal (13.6%, a difference of 0.50%), Immigrants from Mexico (13.6%, a difference of 0.63%), Belizean (13.6%, a difference of 0.77%), and Central American (13.4%, a difference of 0.89%).
| Demographics | Rating | Rank | Seniors Poverty Over the Age of 65 |
| Paiute | 0.0 /100 | #277 | Tragic 12.9% |
| Immigrants | Bahamas | 0.0 /100 | #278 | Tragic 13.0% |
| Mexicans | 0.0 /100 | #279 | Tragic 13.1% |
| Yuman | 0.0 /100 | #280 | Tragic 13.1% |
| Immigrants | El Salvador | 0.0 /100 | #281 | Tragic 13.1% |
| Senegalese | 0.0 /100 | #282 | Tragic 13.3% |
| Central Americans | 0.0 /100 | #283 | Tragic 13.4% |
| Colville | 0.0 /100 | #284 | Tragic 13.5% |
| Guatemalans | 0.0 /100 | #285 | Tragic 13.5% |
| Immigrants | Senegal | 0.0 /100 | #286 | Tragic 13.6% |
| Immigrants | Mexico | 0.0 /100 | #287 | Tragic 13.6% |
| Belizeans | 0.0 /100 | #288 | Tragic 13.6% |
| Jamaicans | 0.0 /100 | #289 | Tragic 13.6% |
| Immigrants | Central America | 0.0 /100 | #290 | Tragic 13.6% |
| Blacks/African Americans | 0.0 /100 | #291 | Tragic 13.7% |