Immigrants from Croatia vs Immigrants from Western Africa Female Poverty Among 25-34 Year Olds
COMPARE
Immigrants from Croatia
Immigrants from Western Africa
Female Poverty Among 25-34 Year Olds
Female Poverty Among 25-34 Year Olds Comparison
Immigrants from Croatia
Immigrants from Western Africa
12.0%
FEMALE POVERTY AMONG 25-34 YEAR OLDS
99.6/ 100
METRIC RATING
50th/ 347
METRIC RANK
14.9%
FEMALE POVERTY AMONG 25-34 YEAR OLDS
0.8/ 100
METRIC RATING
248th/ 347
METRIC RANK
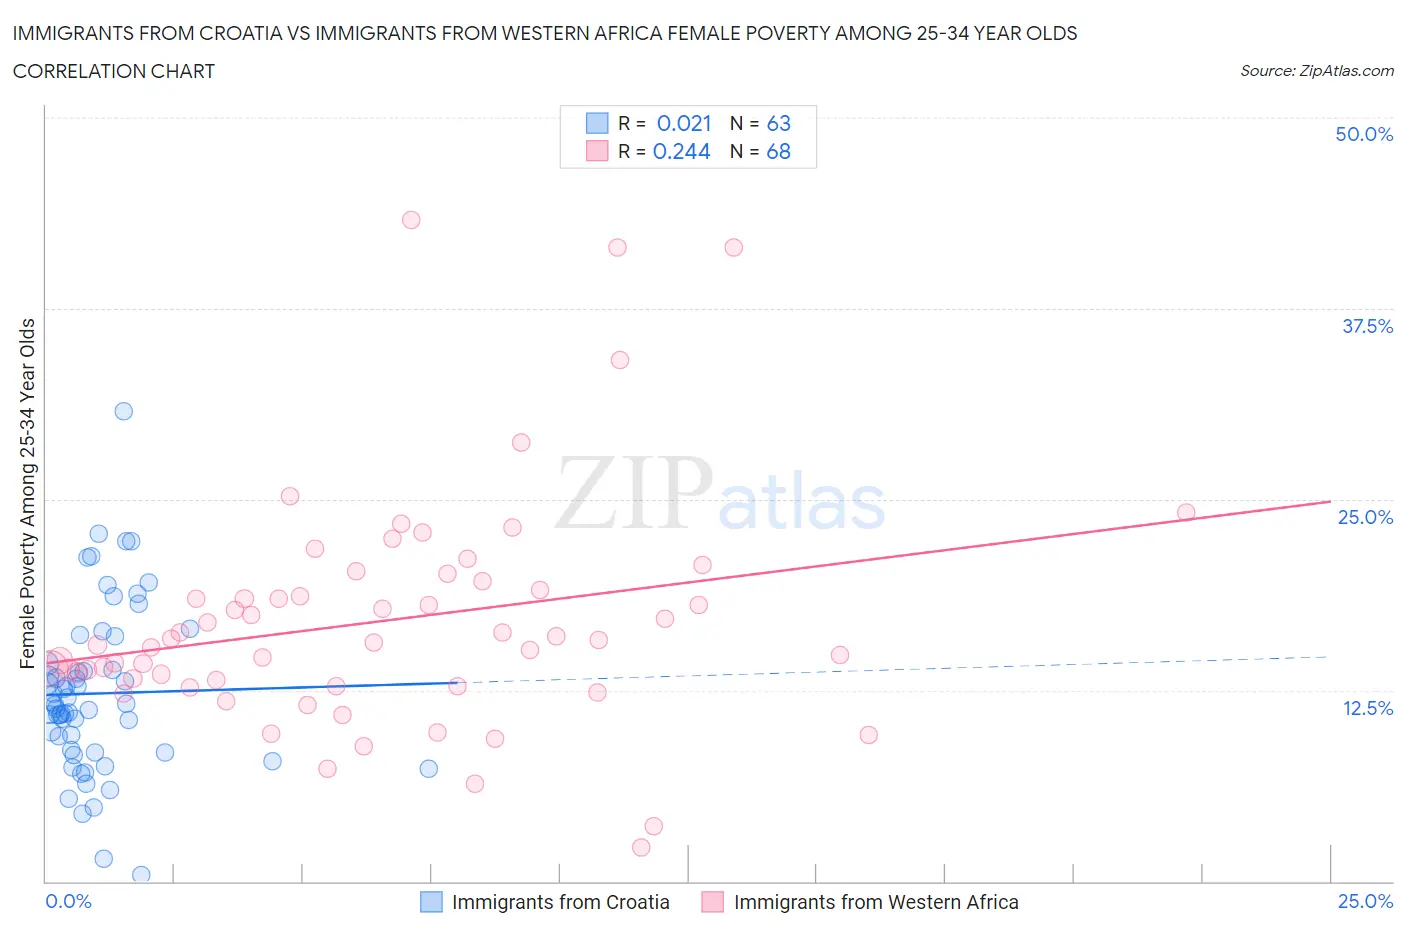
Immigrants from Croatia vs Immigrants from Western Africa Female Poverty Among 25-34 Year Olds Correlation Chart
The statistical analysis conducted on geographies consisting of 131,557,696 people shows no correlation between the proportion of Immigrants from Croatia and poverty level among females between the ages 25 and 34 in the United States with a correlation coefficient (R) of 0.021 and weighted average of 12.0%. Similarly, the statistical analysis conducted on geographies consisting of 353,797,695 people shows a weak positive correlation between the proportion of Immigrants from Western Africa and poverty level among females between the ages 25 and 34 in the United States with a correlation coefficient (R) of 0.244 and weighted average of 14.9%, a difference of 24.2%.
Female Poverty Among 25-34 Year Olds Correlation Summary
| Measurement | Immigrants from Croatia | Immigrants from Western Africa |
| Minimum | 0.42% | 2.2% |
| Maximum | 30.8% | 43.3% |
| Range | 30.3% | 41.1% |
| Mean | 12.3% | 17.0% |
| Median | 11.5% | 15.7% |
| Interquartile 25% (IQ1) | 8.5% | 13.0% |
| Interquartile 75% (IQ3) | 14.2% | 19.3% |
| Interquartile Range (IQR) | 5.8% | 6.4% |
| Standard Deviation (Sample) | 5.5% | 7.6% |
| Standard Deviation (Population) | 5.4% | 7.6% |
Similar Demographics by Female Poverty Among 25-34 Year Olds
Demographics Similar to Immigrants from Croatia by Female Poverty Among 25-34 Year Olds
In terms of female poverty among 25-34 year olds, the demographic groups most similar to Immigrants from Croatia are Paraguayan (12.0%, a difference of 0.010%), Immigrants from Egypt (12.0%, a difference of 0.020%), Immigrants from Eastern Europe (12.0%, a difference of 0.030%), Immigrants from Belarus (12.0%, a difference of 0.090%), and Korean (12.0%, a difference of 0.15%).
| Demographics | Rating | Rank | Female Poverty Among 25-34 Year Olds |
| Egyptians | 99.7 /100 | #43 | Exceptional 11.9% |
| Immigrants | Australia | 99.7 /100 | #44 | Exceptional 11.9% |
| Macedonians | 99.7 /100 | #45 | Exceptional 11.9% |
| Immigrants | Serbia | 99.7 /100 | #46 | Exceptional 11.9% |
| Koreans | 99.6 /100 | #47 | Exceptional 12.0% |
| Immigrants | Belarus | 99.6 /100 | #48 | Exceptional 12.0% |
| Immigrants | Egypt | 99.6 /100 | #49 | Exceptional 12.0% |
| Immigrants | Croatia | 99.6 /100 | #50 | Exceptional 12.0% |
| Paraguayans | 99.6 /100 | #51 | Exceptional 12.0% |
| Immigrants | Eastern Europe | 99.6 /100 | #52 | Exceptional 12.0% |
| Immigrants | Israel | 99.6 /100 | #53 | Exceptional 12.0% |
| Eastern Europeans | 99.6 /100 | #54 | Exceptional 12.0% |
| Immigrants | Philippines | 99.5 /100 | #55 | Exceptional 12.0% |
| Luxembourgers | 99.5 /100 | #56 | Exceptional 12.1% |
| Jordanians | 99.4 /100 | #57 | Exceptional 12.1% |
Demographics Similar to Immigrants from Western Africa by Female Poverty Among 25-34 Year Olds
In terms of female poverty among 25-34 year olds, the demographic groups most similar to Immigrants from Western Africa are German Russian (14.9%, a difference of 0.040%), Jamaican (14.8%, a difference of 0.38%), Immigrants from Middle Africa (14.8%, a difference of 0.42%), Immigrants from Bangladesh (14.8%, a difference of 0.60%), and Immigrants from Nicaragua (14.8%, a difference of 0.61%).
| Demographics | Rating | Rank | Female Poverty Among 25-34 Year Olds |
| Scotch-Irish | 1.2 /100 | #241 | Tragic 14.8% |
| Barbadians | 1.2 /100 | #242 | Tragic 14.8% |
| Immigrants | Nicaragua | 1.1 /100 | #243 | Tragic 14.8% |
| Immigrants | Bangladesh | 1.1 /100 | #244 | Tragic 14.8% |
| Immigrants | Middle Africa | 1.0 /100 | #245 | Tragic 14.8% |
| Jamaicans | 1.0 /100 | #246 | Tragic 14.8% |
| German Russians | 0.8 /100 | #247 | Tragic 14.9% |
| Immigrants | Western Africa | 0.8 /100 | #248 | Tragic 14.9% |
| Immigrants | Haiti | 0.5 /100 | #249 | Tragic 15.0% |
| Immigrants | El Salvador | 0.5 /100 | #250 | Tragic 15.0% |
| Haitians | 0.5 /100 | #251 | Tragic 15.0% |
| Belizeans | 0.4 /100 | #252 | Tragic 15.1% |
| Immigrants | West Indies | 0.4 /100 | #253 | Tragic 15.1% |
| Somalis | 0.4 /100 | #254 | Tragic 15.1% |
| Immigrants | Laos | 0.3 /100 | #255 | Tragic 15.2% |