Immigrants from Chile vs Jordanian Child Poverty Under the Age of 16
COMPARE
Immigrants from Chile
Jordanian
Child Poverty Under the Age of 16
Child Poverty Under the Age of 16 Comparison
Immigrants from Chile
Jordanians
15.7%
CHILD POVERTY UNDER THE AGE OF 16
72.8/ 100
METRIC RATING
158th/ 347
METRIC RANK
14.8%
CHILD POVERTY UNDER THE AGE OF 16
94.2/ 100
METRIC RATING
108th/ 347
METRIC RANK
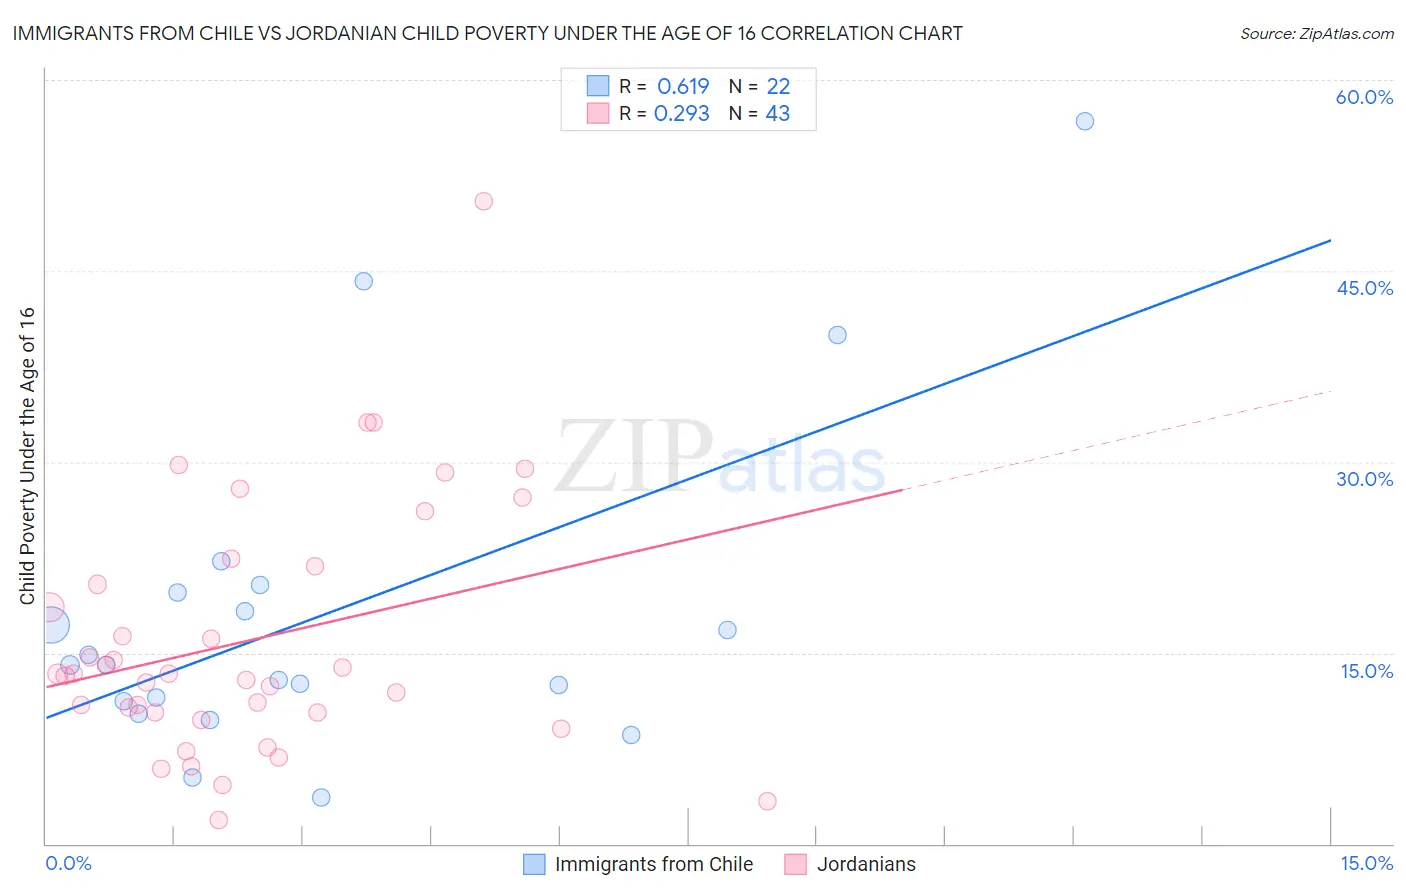
Immigrants from Chile vs Jordanian Child Poverty Under the Age of 16 Correlation Chart
The statistical analysis conducted on geographies consisting of 217,865,801 people shows a significant positive correlation between the proportion of Immigrants from Chile and poverty level among children under the age of 16 in the United States with a correlation coefficient (R) of 0.619 and weighted average of 15.7%. Similarly, the statistical analysis conducted on geographies consisting of 165,957,171 people shows a weak positive correlation between the proportion of Jordanians and poverty level among children under the age of 16 in the United States with a correlation coefficient (R) of 0.293 and weighted average of 14.8%, a difference of 5.9%.
Child Poverty Under the Age of 16 Correlation Summary
| Measurement | Immigrants from Chile | Jordanian |
| Minimum | 3.6% | 1.8% |
| Maximum | 56.8% | 50.5% |
| Range | 53.2% | 48.6% |
| Mean | 18.0% | 16.0% |
| Median | 14.0% | 13.3% |
| Interquartile 25% (IQ1) | 11.2% | 10.3% |
| Interquartile 75% (IQ3) | 19.8% | 21.8% |
| Interquartile Range (IQR) | 8.6% | 11.5% |
| Standard Deviation (Sample) | 12.9% | 9.8% |
| Standard Deviation (Population) | 12.6% | 9.7% |
Similar Demographics by Child Poverty Under the Age of 16
Demographics Similar to Immigrants from Chile by Child Poverty Under the Age of 16
In terms of child poverty under the age of 16, the demographic groups most similar to Immigrants from Chile are Immigrants from Nepal (15.7%, a difference of 0.020%), Immigrants from Fiji (15.8%, a difference of 0.26%), Immigrants from Albania (15.8%, a difference of 0.32%), Immigrants from Venezuela (15.7%, a difference of 0.33%), and Syrian (15.6%, a difference of 0.53%).
| Demographics | Rating | Rank | Child Poverty Under the Age of 16 |
| French | 78.5 /100 | #151 | Good 15.6% |
| French Canadians | 78.2 /100 | #152 | Good 15.6% |
| Venezuelans | 77.4 /100 | #153 | Good 15.6% |
| Samoans | 77.3 /100 | #154 | Good 15.6% |
| Syrians | 76.1 /100 | #155 | Good 15.6% |
| Immigrants | Venezuela | 74.9 /100 | #156 | Good 15.7% |
| Immigrants | Nepal | 72.9 /100 | #157 | Good 15.7% |
| Immigrants | Chile | 72.8 /100 | #158 | Good 15.7% |
| Immigrants | Fiji | 71.1 /100 | #159 | Good 15.8% |
| Immigrants | Albania | 70.7 /100 | #160 | Good 15.8% |
| Immigrants | Northern Africa | 68.1 /100 | #161 | Good 15.8% |
| Colombians | 67.6 /100 | #162 | Good 15.8% |
| Yugoslavians | 67.6 /100 | #163 | Good 15.8% |
| Immigrants | Germany | 67.3 /100 | #164 | Good 15.8% |
| Guamanians/Chamorros | 66.4 /100 | #165 | Good 15.9% |
Demographics Similar to Jordanians by Child Poverty Under the Age of 16
In terms of child poverty under the age of 16, the demographic groups most similar to Jordanians are Tlingit-Haida (14.9%, a difference of 0.070%), Chilean (14.8%, a difference of 0.090%), Serbian (14.8%, a difference of 0.15%), Basque (14.8%, a difference of 0.28%), and Immigrants from England (14.8%, a difference of 0.39%).
| Demographics | Rating | Rank | Child Poverty Under the Age of 16 |
| Immigrants | Switzerland | 95.1 /100 | #101 | Exceptional 14.8% |
| Romanians | 95.0 /100 | #102 | Exceptional 14.8% |
| Immigrants | Egypt | 94.9 /100 | #103 | Exceptional 14.8% |
| Immigrants | England | 94.8 /100 | #104 | Exceptional 14.8% |
| Basques | 94.7 /100 | #105 | Exceptional 14.8% |
| Serbians | 94.5 /100 | #106 | Exceptional 14.8% |
| Chileans | 94.4 /100 | #107 | Exceptional 14.8% |
| Jordanians | 94.2 /100 | #108 | Exceptional 14.8% |
| Tlingit-Haida | 94.1 /100 | #109 | Exceptional 14.9% |
| English | 93.5 /100 | #110 | Exceptional 14.9% |
| Immigrants | Denmark | 93.5 /100 | #111 | Exceptional 14.9% |
| Irish | 93.4 /100 | #112 | Exceptional 14.9% |
| Belgians | 93.3 /100 | #113 | Exceptional 14.9% |
| Sri Lankans | 93.2 /100 | #114 | Exceptional 14.9% |
| Immigrants | Ukraine | 93.1 /100 | #115 | Exceptional 14.9% |