Immigrants from Canada vs Okinawan Female Poverty Among 18-24 Year Olds
COMPARE
Immigrants from Canada
Okinawan
Female Poverty Among 18-24 Year Olds
Female Poverty Among 18-24 Year Olds Comparison
Immigrants from Canada
Okinawans
19.5%
FEMALE POVERTY AMONG 18-24 YEAR OLDS
92.9/ 100
METRIC RATING
130th/ 347
METRIC RANK
20.8%
FEMALE POVERTY AMONG 18-24 YEAR OLDS
4.9/ 100
METRIC RATING
236th/ 347
METRIC RANK
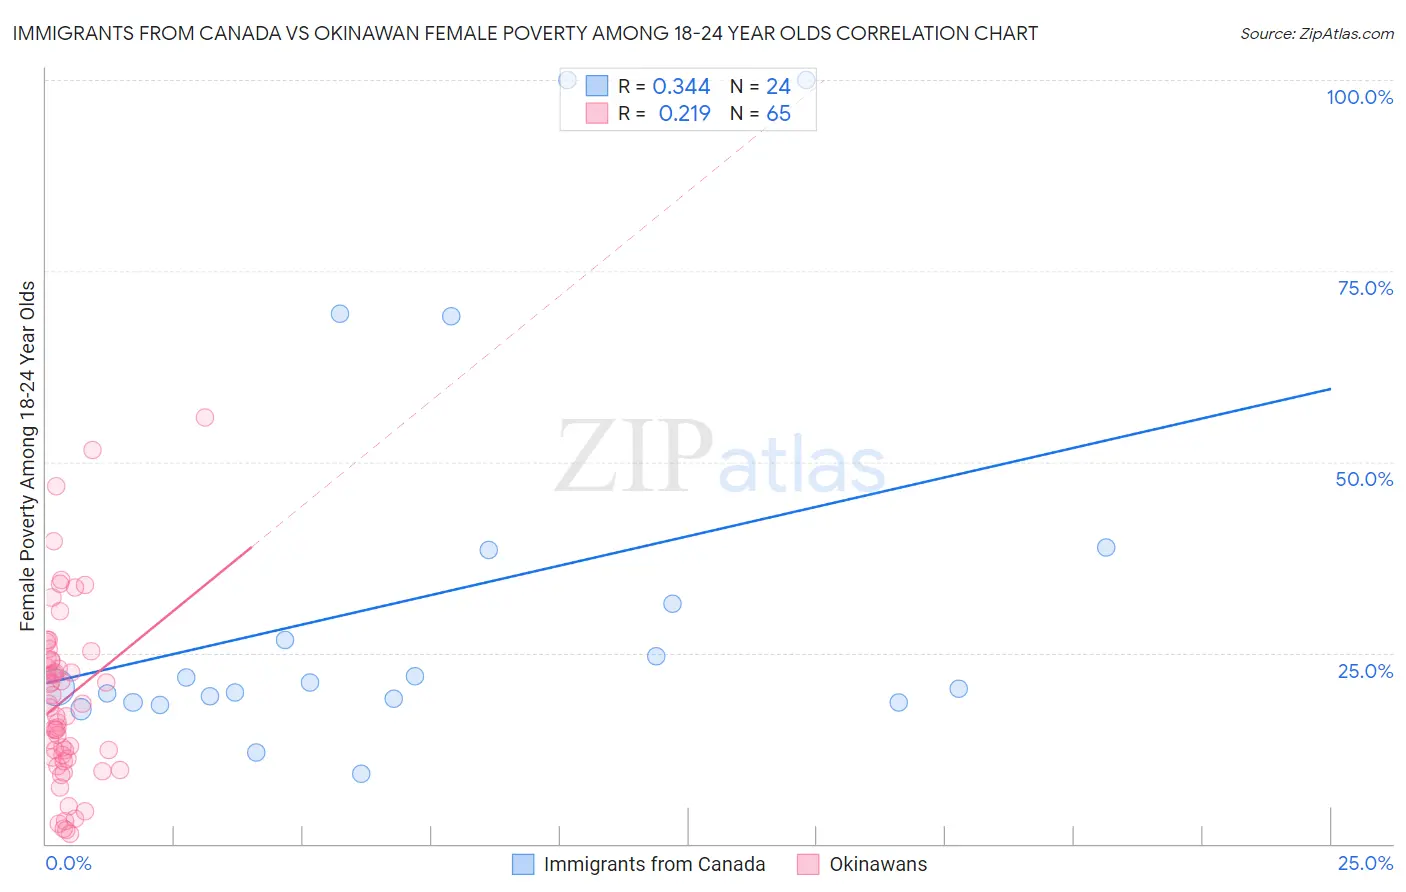
Immigrants from Canada vs Okinawan Female Poverty Among 18-24 Year Olds Correlation Chart
The statistical analysis conducted on geographies consisting of 442,828,957 people shows a mild positive correlation between the proportion of Immigrants from Canada and poverty level among females between the ages 18 and 24 in the United States with a correlation coefficient (R) of 0.344 and weighted average of 19.5%. Similarly, the statistical analysis conducted on geographies consisting of 73,400,379 people shows a weak positive correlation between the proportion of Okinawans and poverty level among females between the ages 18 and 24 in the United States with a correlation coefficient (R) of 0.219 and weighted average of 20.8%, a difference of 7.0%.
Female Poverty Among 18-24 Year Olds Correlation Summary
| Measurement | Immigrants from Canada | Okinawan |
| Minimum | 9.1% | 1.3% |
| Maximum | 100.0% | 55.8% |
| Range | 90.9% | 54.6% |
| Mean | 32.3% | 19.0% |
| Median | 20.8% | 17.8% |
| Interquartile 25% (IQ1) | 18.7% | 11.2% |
| Interquartile 75% (IQ3) | 34.9% | 24.2% |
| Interquartile Range (IQR) | 16.2% | 13.0% |
| Standard Deviation (Sample) | 25.6% | 11.5% |
| Standard Deviation (Population) | 25.1% | 11.5% |
Similar Demographics by Female Poverty Among 18-24 Year Olds
Demographics Similar to Immigrants from Canada by Female Poverty Among 18-24 Year Olds
In terms of female poverty among 18-24 year olds, the demographic groups most similar to Immigrants from Canada are Immigrants from England (19.5%, a difference of 0.0%), Slovak (19.5%, a difference of 0.010%), Latvian (19.5%, a difference of 0.040%), Cape Verdean (19.4%, a difference of 0.14%), and Jamaican (19.5%, a difference of 0.14%).
| Demographics | Rating | Rank | Female Poverty Among 18-24 Year Olds |
| Paraguayans | 94.6 /100 | #123 | Exceptional 19.4% |
| Immigrants | Chile | 94.3 /100 | #124 | Exceptional 19.4% |
| Immigrants | Panama | 94.0 /100 | #125 | Exceptional 19.4% |
| Immigrants | Russia | 93.7 /100 | #126 | Exceptional 19.4% |
| Cape Verdeans | 93.6 /100 | #127 | Exceptional 19.4% |
| Slovaks | 92.9 /100 | #128 | Exceptional 19.5% |
| Immigrants | England | 92.9 /100 | #129 | Exceptional 19.5% |
| Immigrants | Canada | 92.9 /100 | #130 | Exceptional 19.5% |
| Latvians | 92.7 /100 | #131 | Exceptional 19.5% |
| Jamaicans | 92.1 /100 | #132 | Exceptional 19.5% |
| Turks | 92.1 /100 | #133 | Exceptional 19.5% |
| Immigrants | North America | 92.1 /100 | #134 | Exceptional 19.5% |
| Soviet Union | 92.0 /100 | #135 | Exceptional 19.5% |
| Russians | 91.5 /100 | #136 | Exceptional 19.5% |
| Austrians | 90.7 /100 | #137 | Exceptional 19.5% |
Demographics Similar to Okinawans by Female Poverty Among 18-24 Year Olds
In terms of female poverty among 18-24 year olds, the demographic groups most similar to Okinawans are Immigrants from Uganda (20.8%, a difference of 0.040%), Scottish (20.9%, a difference of 0.10%), Welsh (20.8%, a difference of 0.13%), Immigrants from Singapore (20.9%, a difference of 0.14%), and Immigrants from Guatemala (20.9%, a difference of 0.15%).
| Demographics | Rating | Rank | Female Poverty Among 18-24 Year Olds |
| Australians | 6.1 /100 | #229 | Tragic 20.8% |
| Whites/Caucasians | 6.1 /100 | #230 | Tragic 20.8% |
| Immigrants | St. Vincent and the Grenadines | 6.0 /100 | #231 | Tragic 20.8% |
| Finns | 6.0 /100 | #232 | Tragic 20.8% |
| Immigrants | Denmark | 5.8 /100 | #233 | Tragic 20.8% |
| Welsh | 5.4 /100 | #234 | Tragic 20.8% |
| Immigrants | Uganda | 5.1 /100 | #235 | Tragic 20.8% |
| Okinawans | 4.9 /100 | #236 | Tragic 20.8% |
| Scottish | 4.5 /100 | #237 | Tragic 20.9% |
| Immigrants | Singapore | 4.4 /100 | #238 | Tragic 20.9% |
| Immigrants | Guatemala | 4.3 /100 | #239 | Tragic 20.9% |
| Luxembourgers | 4.2 /100 | #240 | Tragic 20.9% |
| Immigrants | Eritrea | 4.2 /100 | #241 | Tragic 20.9% |
| Israelis | 4.1 /100 | #242 | Tragic 20.9% |
| Marshallese | 3.4 /100 | #243 | Tragic 20.9% |