Immigrants from Canada vs Immigrants from Iraq Female Poverty Among 18-24 Year Olds
COMPARE
Immigrants from Canada
Immigrants from Iraq
Female Poverty Among 18-24 Year Olds
Female Poverty Among 18-24 Year Olds Comparison
Immigrants from Canada
Immigrants from Iraq
19.5%
FEMALE POVERTY AMONG 18-24 YEAR OLDS
92.9/ 100
METRIC RATING
130th/ 347
METRIC RANK
18.9%
FEMALE POVERTY AMONG 18-24 YEAR OLDS
99.2/ 100
METRIC RATING
86th/ 347
METRIC RANK
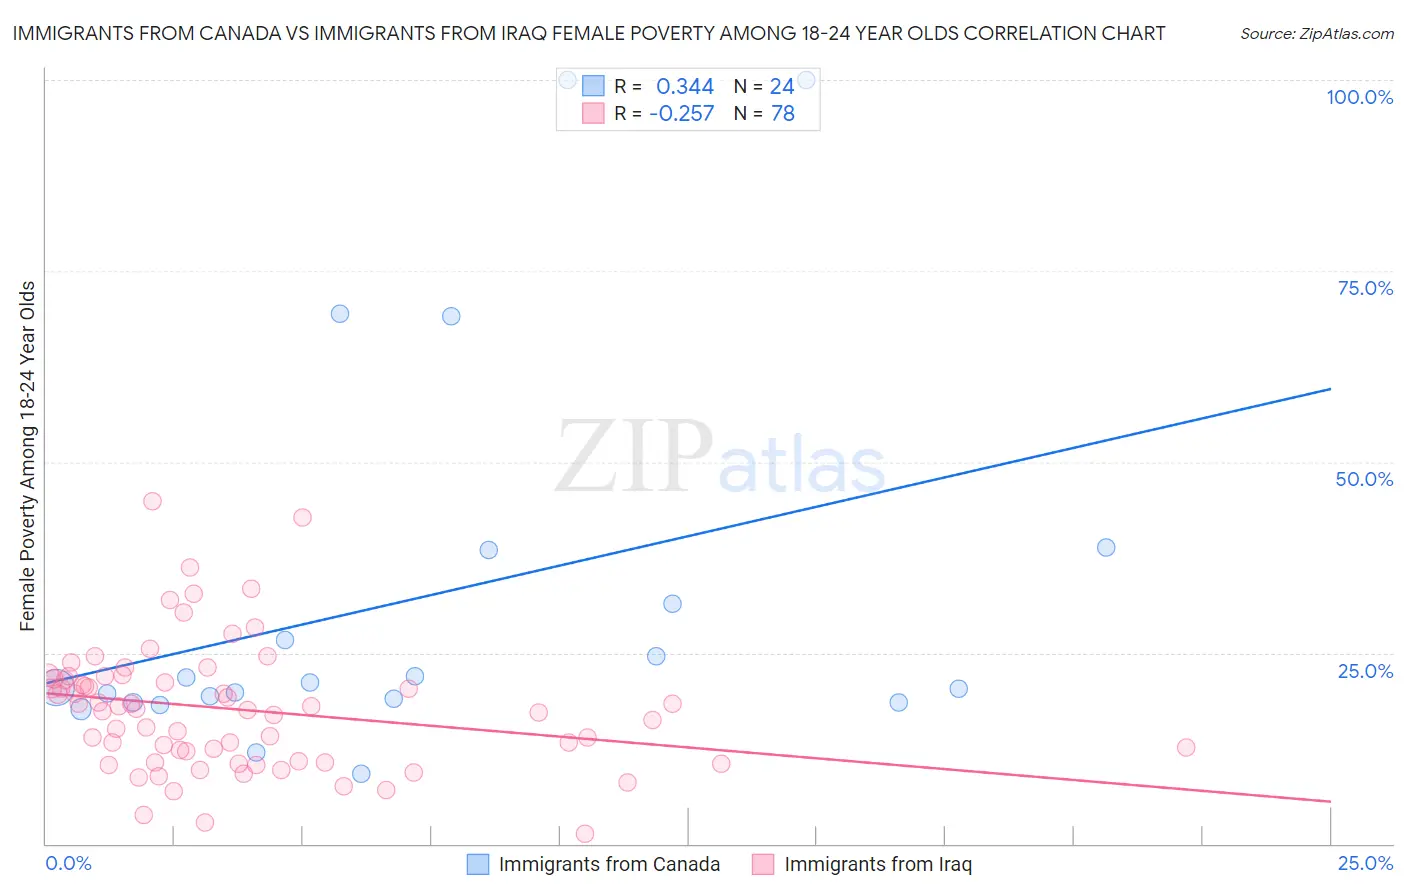
Immigrants from Canada vs Immigrants from Iraq Female Poverty Among 18-24 Year Olds Correlation Chart
The statistical analysis conducted on geographies consisting of 442,828,957 people shows a mild positive correlation between the proportion of Immigrants from Canada and poverty level among females between the ages 18 and 24 in the United States with a correlation coefficient (R) of 0.344 and weighted average of 19.5%. Similarly, the statistical analysis conducted on geographies consisting of 193,059,376 people shows a weak negative correlation between the proportion of Immigrants from Iraq and poverty level among females between the ages 18 and 24 in the United States with a correlation coefficient (R) of -0.257 and weighted average of 18.9%, a difference of 2.9%.
Female Poverty Among 18-24 Year Olds Correlation Summary
| Measurement | Immigrants from Canada | Immigrants from Iraq |
| Minimum | 9.1% | 1.3% |
| Maximum | 100.0% | 44.8% |
| Range | 90.9% | 43.5% |
| Mean | 32.3% | 17.6% |
| Median | 20.8% | 17.5% |
| Interquartile 25% (IQ1) | 18.7% | 10.8% |
| Interquartile 75% (IQ3) | 34.9% | 21.6% |
| Interquartile Range (IQR) | 16.2% | 10.8% |
| Standard Deviation (Sample) | 25.6% | 8.3% |
| Standard Deviation (Population) | 25.1% | 8.3% |
Similar Demographics by Female Poverty Among 18-24 Year Olds
Demographics Similar to Immigrants from Canada by Female Poverty Among 18-24 Year Olds
In terms of female poverty among 18-24 year olds, the demographic groups most similar to Immigrants from Canada are Immigrants from England (19.5%, a difference of 0.0%), Slovak (19.5%, a difference of 0.010%), Latvian (19.5%, a difference of 0.040%), Cape Verdean (19.4%, a difference of 0.14%), and Jamaican (19.5%, a difference of 0.14%).
| Demographics | Rating | Rank | Female Poverty Among 18-24 Year Olds |
| Paraguayans | 94.6 /100 | #123 | Exceptional 19.4% |
| Immigrants | Chile | 94.3 /100 | #124 | Exceptional 19.4% |
| Immigrants | Panama | 94.0 /100 | #125 | Exceptional 19.4% |
| Immigrants | Russia | 93.7 /100 | #126 | Exceptional 19.4% |
| Cape Verdeans | 93.6 /100 | #127 | Exceptional 19.4% |
| Slovaks | 92.9 /100 | #128 | Exceptional 19.5% |
| Immigrants | England | 92.9 /100 | #129 | Exceptional 19.5% |
| Immigrants | Canada | 92.9 /100 | #130 | Exceptional 19.5% |
| Latvians | 92.7 /100 | #131 | Exceptional 19.5% |
| Jamaicans | 92.1 /100 | #132 | Exceptional 19.5% |
| Turks | 92.1 /100 | #133 | Exceptional 19.5% |
| Immigrants | North America | 92.1 /100 | #134 | Exceptional 19.5% |
| Soviet Union | 92.0 /100 | #135 | Exceptional 19.5% |
| Russians | 91.5 /100 | #136 | Exceptional 19.5% |
| Austrians | 90.7 /100 | #137 | Exceptional 19.5% |
Demographics Similar to Immigrants from Iraq by Female Poverty Among 18-24 Year Olds
In terms of female poverty among 18-24 year olds, the demographic groups most similar to Immigrants from Iraq are Immigrants from Jamaica (18.9%, a difference of 0.010%), Immigrants from Armenia (18.9%, a difference of 0.070%), Burmese (18.9%, a difference of 0.11%), Croatian (19.0%, a difference of 0.16%), and Immigrants from Cabo Verde (19.0%, a difference of 0.18%).
| Demographics | Rating | Rank | Female Poverty Among 18-24 Year Olds |
| Uruguayans | 99.5 /100 | #79 | Exceptional 18.8% |
| Palestinians | 99.5 /100 | #80 | Exceptional 18.8% |
| Japanese | 99.5 /100 | #81 | Exceptional 18.8% |
| Immigrants | Uruguay | 99.4 /100 | #82 | Exceptional 18.8% |
| Immigrants | Indonesia | 99.4 /100 | #83 | Exceptional 18.9% |
| Burmese | 99.2 /100 | #84 | Exceptional 18.9% |
| Immigrants | Armenia | 99.2 /100 | #85 | Exceptional 18.9% |
| Immigrants | Iraq | 99.2 /100 | #86 | Exceptional 18.9% |
| Immigrants | Jamaica | 99.2 /100 | #87 | Exceptional 18.9% |
| Croatians | 99.1 /100 | #88 | Exceptional 19.0% |
| Immigrants | Cabo Verde | 99.0 /100 | #89 | Exceptional 19.0% |
| Afghans | 99.0 /100 | #90 | Exceptional 19.0% |
| Romanians | 98.9 /100 | #91 | Exceptional 19.0% |
| Filipinos | 98.9 /100 | #92 | Exceptional 19.0% |
| Haitians | 98.9 /100 | #93 | Exceptional 19.0% |