British West Indian vs Okinawan Female Poverty Among 18-24 Year Olds
COMPARE
British West Indian
Okinawan
Female Poverty Among 18-24 Year Olds
Female Poverty Among 18-24 Year Olds Comparison
British West Indians
Okinawans
21.2%
FEMALE POVERTY AMONG 18-24 YEAR OLDS
1.2/ 100
METRIC RATING
254th/ 347
METRIC RANK
20.8%
FEMALE POVERTY AMONG 18-24 YEAR OLDS
4.9/ 100
METRIC RATING
236th/ 347
METRIC RANK
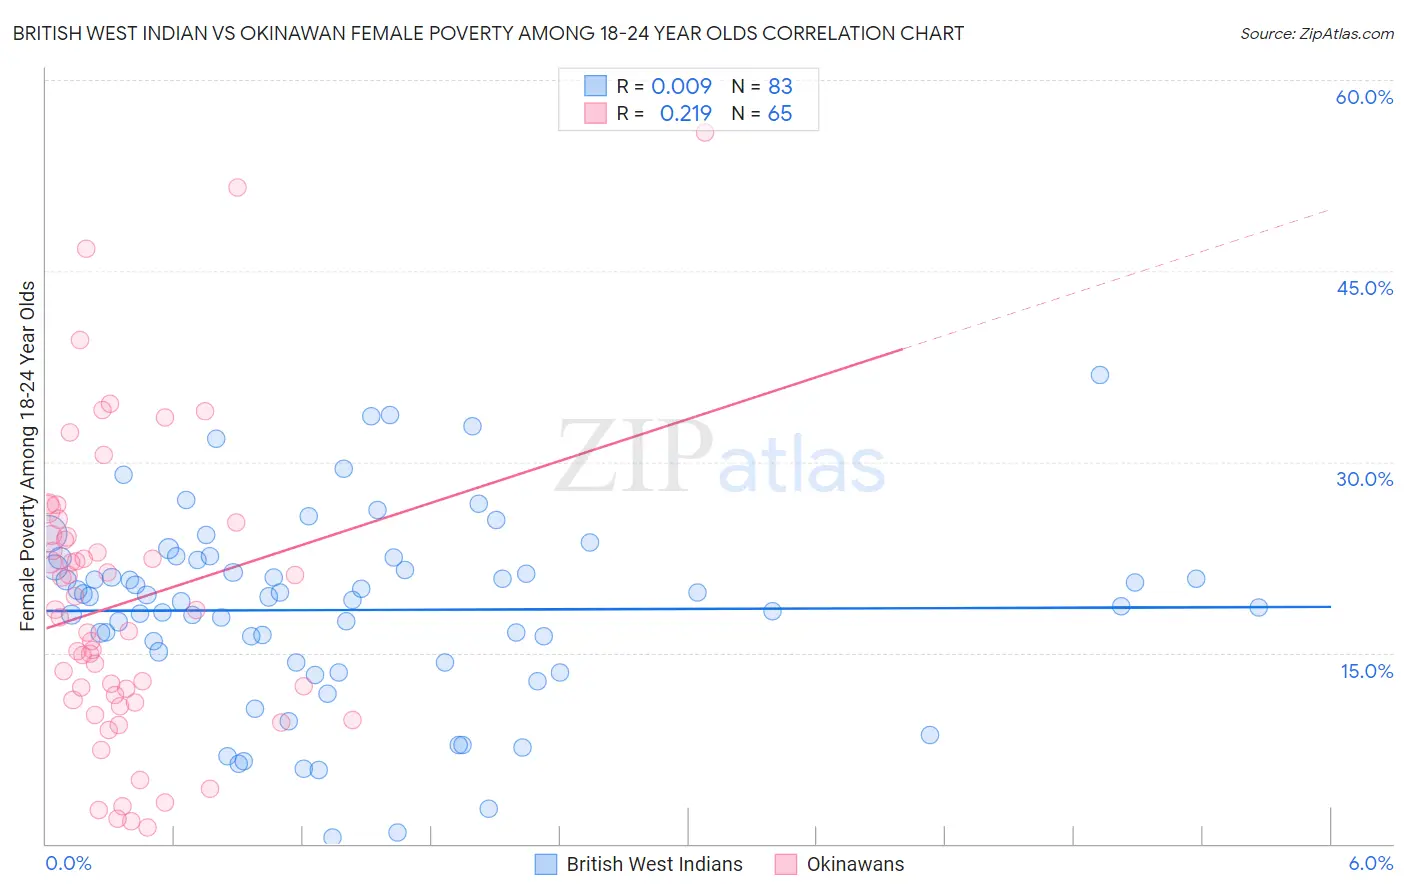
British West Indian vs Okinawan Female Poverty Among 18-24 Year Olds Correlation Chart
The statistical analysis conducted on geographies consisting of 151,313,646 people shows no correlation between the proportion of British West Indians and poverty level among females between the ages 18 and 24 in the United States with a correlation coefficient (R) of 0.009 and weighted average of 21.2%. Similarly, the statistical analysis conducted on geographies consisting of 73,400,379 people shows a weak positive correlation between the proportion of Okinawans and poverty level among females between the ages 18 and 24 in the United States with a correlation coefficient (R) of 0.219 and weighted average of 20.8%, a difference of 1.7%.
Female Poverty Among 18-24 Year Olds Correlation Summary
| Measurement | British West Indian | Okinawan |
| Minimum | 0.52% | 1.3% |
| Maximum | 36.8% | 55.8% |
| Range | 36.3% | 54.6% |
| Mean | 18.4% | 19.0% |
| Median | 19.4% | 17.8% |
| Interquartile 25% (IQ1) | 14.3% | 11.2% |
| Interquartile 75% (IQ3) | 22.3% | 24.2% |
| Interquartile Range (IQR) | 8.1% | 13.0% |
| Standard Deviation (Sample) | 7.4% | 11.5% |
| Standard Deviation (Population) | 7.3% | 11.5% |
Demographics Similar to British West Indians and Okinawans by Female Poverty Among 18-24 Year Olds
In terms of female poverty among 18-24 year olds, the demographic groups most similar to British West Indians are Immigrants from Grenada (21.2%, a difference of 0.030%), Delaware (21.1%, a difference of 0.29%), South African (21.1%, a difference of 0.33%), West Indian (21.1%, a difference of 0.52%), and Immigrants from West Indies (21.0%, a difference of 0.72%). Similarly, the demographic groups most similar to Okinawans are Immigrants from Uganda (20.8%, a difference of 0.040%), Scottish (20.9%, a difference of 0.10%), Immigrants from Singapore (20.9%, a difference of 0.14%), Immigrants from Guatemala (20.9%, a difference of 0.15%), and Luxembourger (20.9%, a difference of 0.18%).
| Demographics | Rating | Rank | Female Poverty Among 18-24 Year Olds |
| Immigrants | Uganda | 5.1 /100 | #235 | Tragic 20.8% |
| Okinawans | 4.9 /100 | #236 | Tragic 20.8% |
| Scottish | 4.5 /100 | #237 | Tragic 20.9% |
| Immigrants | Singapore | 4.4 /100 | #238 | Tragic 20.9% |
| Immigrants | Guatemala | 4.3 /100 | #239 | Tragic 20.9% |
| Luxembourgers | 4.2 /100 | #240 | Tragic 20.9% |
| Immigrants | Eritrea | 4.2 /100 | #241 | Tragic 20.9% |
| Israelis | 4.1 /100 | #242 | Tragic 20.9% |
| Marshallese | 3.4 /100 | #243 | Tragic 20.9% |
| Immigrants | Thailand | 3.4 /100 | #244 | Tragic 20.9% |
| Aleuts | 3.3 /100 | #245 | Tragic 20.9% |
| Immigrants | Australia | 3.1 /100 | #246 | Tragic 20.9% |
| Immigrants | Africa | 3.0 /100 | #247 | Tragic 21.0% |
| Immigrants | Kenya | 2.5 /100 | #248 | Tragic 21.0% |
| Carpatho Rusyns | 2.5 /100 | #249 | Tragic 21.0% |
| Immigrants | West Indies | 2.2 /100 | #250 | Tragic 21.0% |
| West Indians | 1.9 /100 | #251 | Tragic 21.1% |
| South Africans | 1.6 /100 | #252 | Tragic 21.1% |
| Delaware | 1.6 /100 | #253 | Tragic 21.1% |
| British West Indians | 1.2 /100 | #254 | Tragic 21.2% |
| Immigrants | Grenada | 1.2 /100 | #255 | Tragic 21.2% |