Immigrants from Cambodia vs Immigrants from Ghana Female Poverty Among 25-34 Year Olds

COMPARE

Immigrants from Cambodia
Race
Ancestry
AfghanAfricanAlaska NativeAlaskan AthabascanAlbanianAleutAlsatianAmericanApacheArabArapahoArgentineanArmenianAssyrian/Chaldean/SyriacAustralianAustrianBahamianBangladeshiBarbadianBasqueBelgianBelizeanBermudanBhutaneseBlackfeetBolivianBrazilianBritishBritish West IndianBulgarianBurmeseCajunCambodianCanadianCape VerdeanCarpatho RusynCelticCentral AmericanCentral American IndianCherokeeCheyenneChickasawChileanChineseChippewaChoctawColombianColvilleComancheCosta RicanCreeCreekCroatianCrowCubanCypriotCzechCzechoslovakianDanishDelawareDominicanDutchDutch West IndianEastern EuropeanEcuadorianEgyptianEnglishEstonianEthiopianEuropeanFijianFilipinoFinnishFrenchFrench American IndianFrench CanadianGermanGerman RussianGhanaianGreekGuamanian/ChamorroGuatemalanGuyaneseHaitianHmongHonduranHopiHoumaHungarianIcelanderIndian (Asian)IndonesianInupiatIranianIraqiIrishIroquoisIsraeliItalianJamaicanJapaneseJordanianKenyanKiowaKoreanLaotianLatvianLebaneseLiberianLithuanianLumbeeLuxembourgerMacedonianMalaysianMalteseMarshalleseMenomineeMexicanMexican American IndianMongolianMoroccanNative HawaiianNavajoNepaleseNew ZealanderNicaraguanNigerianNorthern EuropeanNorwegianOkinawanOsageOttawaPaiutePakistaniPalestinianPanamanianParaguayanPennsylvania GermanPeruvianPimaPolishPortuguesePotawatomiPuebloPuerto RicanPuget Sound SalishRomanianRussianSalvadoranSamoanScandinavianScotch-IrishScottishSeminoleSenegaleseSerbianShoshoneSierra LeoneanSiouxSlavicSlovakSloveneSomaliSouth AfricanSouth AmericanSouth American IndianSoviet UnionSpaniardSpanishSpanish AmericanSpanish American IndianSri LankanSubsaharan AfricanSudaneseSwedishSwissSyrianTaiwaneseThaiTlingit-HaidaTohono O'OdhamTonganTrinidadian and TobagonianTsimshianTurkishU.S. Virgin IslanderUgandanUkrainianUruguayanUteVenezuelanVietnameseWelshWest IndianYakamaYaquiYugoslavianYumanYup'ikZimbabwean
Immigration
NonimmigrantsImmigrantsAfghanistanAfricaAlbaniaArgentinaArmeniaAsiaAustraliaAustriaBahamasBangladeshBarbadosBelarusBelgiumBelizeBoliviaBosnia and HerzegovinaBrazilBulgariaBurma/MyanmarCabo VerdeCambodiaCameroonCanadaCaribbeanCentral AmericaChileChinaColombiaCongoCosta RicaCroatiaCubaCzechoslovakiaDenmarkDominicaDominican RepublicEastern AfricaEastern AsiaEastern EuropeEcuadorEgyptEl SalvadorEnglandEritreaEthiopiaEuropeFijiFranceGermanyGreeceGrenadaGuatemalaGuyanaHaitiHondurasHong KongHungaryIndiaIndonesiaIranIraqIrelandIsraelItalyJamaicaJapanJordanKazakhstanKenyaKoreaKuwaitLaosLatin AmericaLatviaLebanonLiberiaLithuaniaMalaysiaMexicoMicronesiaMiddle AfricaMoldovaMoroccoNepalNetherlandsNicaraguaNigeriaNorth AmericaNorth MacedoniaNorthern AfricaNorthern EuropeNorwayOceaniaPakistanPanamaPeruPhilippinesPolandPortugalRomaniaRussiaSaudi ArabiaScotlandSenegalSerbiaSierra LeoneSingaporeSomaliaSouth AfricaSouth AmericaSouth Central AsiaSouth Eastern AsiaSouthern EuropeSpainSri LankaSt. Vincent and the GrenadinesSudanSwedenSwitzerlandSyriaTaiwanThailandTrinidad and TobagoTurkeyUgandaUkraineUruguayUzbekistanVenezuelaVietnamWest IndiesWestern AfricaWestern AsiaWestern EuropeYemenZaireZimbabweAzores
Immigrants from Ghana
Race
Ancestry
AfghanAfricanAlaska NativeAlaskan AthabascanAlbanianAleutAlsatianAmericanApacheArabArapahoArgentineanArmenianAssyrian/Chaldean/SyriacAustralianAustrianBahamianBangladeshiBarbadianBasqueBelgianBelizeanBermudanBhutaneseBlackfeetBolivianBrazilianBritishBritish West IndianBulgarianBurmeseCajunCambodianCanadianCape VerdeanCarpatho RusynCelticCentral AmericanCentral American IndianCherokeeCheyenneChickasawChileanChineseChippewaChoctawColombianColvilleComancheCosta RicanCreeCreekCroatianCrowCubanCypriotCzechCzechoslovakianDanishDelawareDominicanDutchDutch West IndianEastern EuropeanEcuadorianEgyptianEnglishEstonianEthiopianEuropeanFijianFilipinoFinnishFrenchFrench American IndianFrench CanadianGermanGerman RussianGhanaianGreekGuamanian/ChamorroGuatemalanGuyaneseHaitianHmongHonduranHopiHoumaHungarianIcelanderIndian (Asian)IndonesianInupiatIranianIraqiIrishIroquoisIsraeliItalianJamaicanJapaneseJordanianKenyanKiowaKoreanLaotianLatvianLebaneseLiberianLithuanianLumbeeLuxembourgerMacedonianMalaysianMalteseMarshalleseMenomineeMexicanMexican American IndianMongolianMoroccanNative HawaiianNavajoNepaleseNew ZealanderNicaraguanNigerianNorthern EuropeanNorwegianOkinawanOsageOttawaPaiutePakistaniPalestinianPanamanianParaguayanPennsylvania GermanPeruvianPimaPolishPortuguesePotawatomiPuebloPuerto RicanPuget Sound SalishRomanianRussianSalvadoranSamoanScandinavianScotch-IrishScottishSeminoleSenegaleseSerbianShoshoneSierra LeoneanSiouxSlavicSlovakSloveneSomaliSouth AfricanSouth AmericanSouth American IndianSoviet UnionSpaniardSpanishSpanish AmericanSpanish American IndianSri LankanSubsaharan AfricanSudaneseSwedishSwissSyrianTaiwaneseThaiTlingit-HaidaTohono O'OdhamTonganTrinidadian and TobagonianTsimshianTurkishU.S. Virgin IslanderUgandanUkrainianUruguayanUteVenezuelanVietnameseWelshWest IndianYakamaYaquiYugoslavianYumanYup'ikZimbabwean
Immigration
NonimmigrantsImmigrantsAfghanistanAfricaAlbaniaArgentinaArmeniaAsiaAustraliaAustriaBahamasBangladeshBarbadosBelarusBelgiumBelizeBoliviaBosnia and HerzegovinaBrazilBulgariaBurma/MyanmarCabo VerdeCameroonCanadaCaribbeanCentral AmericaChileChinaColombiaCongoCosta RicaCroatiaCubaCzechoslovakiaDenmarkDominicaDominican RepublicEastern AfricaEastern AsiaEastern EuropeEcuadorEgyptEl SalvadorEnglandEritreaEthiopiaEuropeFijiFranceGermanyGhanaGreeceGrenadaGuatemalaGuyanaHaitiHondurasHong KongHungaryIndiaIndonesiaIranIraqIrelandIsraelItalyJamaicaJapanJordanKazakhstanKenyaKoreaKuwaitLaosLatin AmericaLatviaLebanonLiberiaLithuaniaMalaysiaMexicoMicronesiaMiddle AfricaMoldovaMoroccoNepalNetherlandsNicaraguaNigeriaNorth AmericaNorth MacedoniaNorthern AfricaNorthern EuropeNorwayOceaniaPakistanPanamaPeruPhilippinesPolandPortugalRomaniaRussiaSaudi ArabiaScotlandSenegalSerbiaSierra LeoneSingaporeSomaliaSouth AfricaSouth AmericaSouth Central AsiaSouth Eastern AsiaSouthern EuropeSpainSri LankaSt. Vincent and the GrenadinesSudanSwedenSwitzerlandSyriaTaiwanThailandTrinidad and TobagoTurkeyUgandaUkraineUruguayUzbekistanVenezuelaVietnamWest IndiesWestern AfricaWestern AsiaWestern EuropeYemenZaireZimbabweAzores
Female Poverty Among 25-34 Year Olds
Income
Poverty
Unemployment
Labor Participation
Family Structure
Vehicle Availability
Education Level
Disability

Female Poverty Among 25-34 Year Olds Comparison

Immigrants from Cambodia

Immigrants from Ghana

Fair
Tragic
13.9%
FEMALE POVERTY AMONG 25-34 YEAR OLDS
24.0/ 100
METRIC RATING
195th/ 347
METRIC RANK
14.7%
FEMALE POVERTY AMONG 25-34 YEAR OLDS
1.4/ 100
METRIC RATING
237th/ 347
METRIC RANK

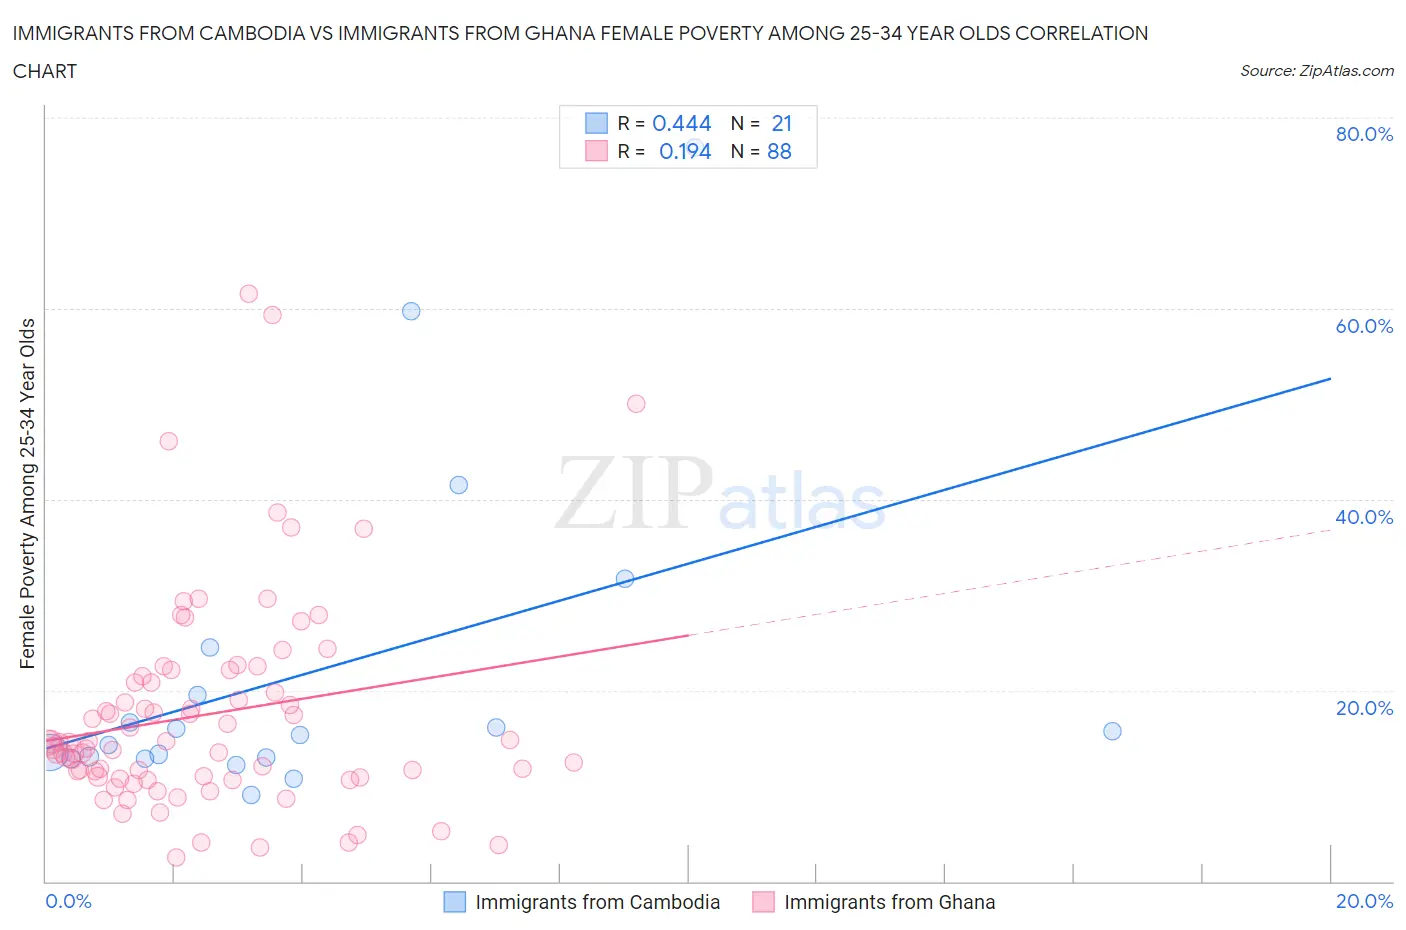
Immigrants from Cambodia vs Immigrants from Ghana Female Poverty Among 25-34 Year Olds Correlation Chart

The statistical analysis conducted on geographies consisting of 203,961,039 people shows a moderate positive correlation between the proportion of Immigrants from Cambodia and poverty level among females between the ages 25 and 34 in the United States with a correlation coefficient (R) of 0.444 and weighted average of 13.9%. Similarly, the statistical analysis conducted on geographies consisting of 198,538,106 people shows a poor positive correlation between the proportion of Immigrants from Ghana and poverty level among females between the ages 25 and 34 in the United States with a correlation coefficient (R) of 0.194 and weighted average of 14.7%, a difference of 6.3%.
Immigrants from Cambodia vs Immigrants from Ghana Female Poverty Among 25-34 Year Olds

Female Poverty Among 25-34 Year Olds Correlation Summary

MeasurementImmigrants from CambodiaImmigrants from Ghana
Minimum9.0%2.5%
Maximum76.9%61.5%
Range68.0%59.1%
Mean21.8%17.4%
Median15.4%14.5%
Interquartile 25% (IQ1)12.9%10.9%
Interquartile 75% (IQ3)22.0%21.2%
Interquartile Range (IQR)9.1%10.3%
Standard Deviation (Sample)17.4%11.1%
Standard Deviation (Population)17.0%11.1%

Similar Demographics by Female Poverty Among 25-34 Year Olds

Demographics Similar to Immigrants from Cambodia by Female Poverty Among 25-34 Year Olds

In terms of female poverty among 25-34 year olds, the demographic groups most similar to Immigrants from Cambodia are Scottish (13.9%, a difference of 0.050%), Moroccan (13.8%, a difference of 0.11%), Immigrants from Saudi Arabia (13.9%, a difference of 0.25%), Immigrants from Germany (13.9%, a difference of 0.36%), and Immigrants from Kenya (13.8%, a difference of 0.42%).
DemographicsRating | RankFemale Poverty Among 25-34 Year Olds
Immigrants | Eritrea
32.7
/100
|
#188
Fair
13.7%
Finns
32.5
/100
|
#189
Fair
13.7%
Dutch
29.7
/100
|
#190
Fair
13.8%
Immigrants | St. Vincent and the Grenadines
29.3
/100
|
#191
Fair
13.8%
Tlingit-Haida
28.1
/100
|
#192
Fair
13.8%
Immigrants | Kenya
28.0
/100
|
#193
Fair
13.8%
Moroccans
25.1
/100
|
#194
Fair
13.8%
Immigrants | Cambodia
24.0
/100
|
#195
Fair
13.9%
Scottish
23.6
/100
|
#196
Fair
13.9%
Immigrants | Saudi Arabia
21.9
/100
|
#197
Fair
13.9%
Immigrants | Germany
20.9
/100
|
#198
Fair
13.9%
English
20.4
/100
|
#199
Fair
13.9%
Hmong
20.3
/100
|
#200
Fair
13.9%
Immigrants | Trinidad and Tobago
17.6
/100
|
#201
Poor
14.0%
Welsh
17.2
/100
|
#202
Poor
14.0%

Demographics Similar to Immigrants from Ghana by Female Poverty Among 25-34 Year Olds

In terms of female poverty among 25-34 year olds, the demographic groups most similar to Immigrants from Ghana are Salvadoran (14.7%, a difference of 0.0%), Immigrants from Jamaica (14.7%, a difference of 0.020%), Alsatian (14.7%, a difference of 0.040%), Malaysian (14.7%, a difference of 0.070%), and Immigrants from Grenada (14.7%, a difference of 0.12%).
DemographicsRating | RankFemale Poverty Among 25-34 Year Olds
Spaniards
2.3
/100
|
#230
Tragic
14.6%
Delaware
2.3
/100
|
#231
Tragic
14.6%
Immigrants | Ecuador
1.9
/100
|
#232
Tragic
14.6%
Whites/Caucasians
1.8
/100
|
#233
Tragic
14.7%
Cubans
1.6
/100
|
#234
Tragic
14.7%
Immigrants | Jamaica
1.4
/100
|
#235
Tragic
14.7%
Salvadorans
1.4
/100
|
#236
Tragic
14.7%
Immigrants | Ghana
1.4
/100
|
#237
Tragic
14.7%
Alsatians
1.4
/100
|
#238
Tragic
14.7%
Malaysians
1.4
/100
|
#239
Tragic
14.7%
Immigrants | Grenada
1.3
/100
|
#240
Tragic
14.7%
Scotch-Irish
1.2
/100
|
#241
Tragic
14.8%
Barbadians
1.2
/100
|
#242
Tragic
14.8%
Immigrants | Nicaragua
1.1
/100
|
#243
Tragic
14.8%
Immigrants | Bangladesh
1.1
/100
|
#244
Tragic
14.8%