Immigrants from Brazil vs Moroccan Seniors Poverty Over the Age of 75
COMPARE
Immigrants from Brazil
Moroccan
Seniors Poverty Over the Age of 75
Seniors Poverty Over the Age of 75 Comparison
Immigrants from Brazil
Moroccans
12.9%
SENIORS POVERTY OVER THE AGE OF 75
5.2/ 100
METRIC RATING
216th/ 347
METRIC RANK
13.3%
SENIORS POVERTY OVER THE AGE OF 75
0.9/ 100
METRIC RATING
236th/ 347
METRIC RANK
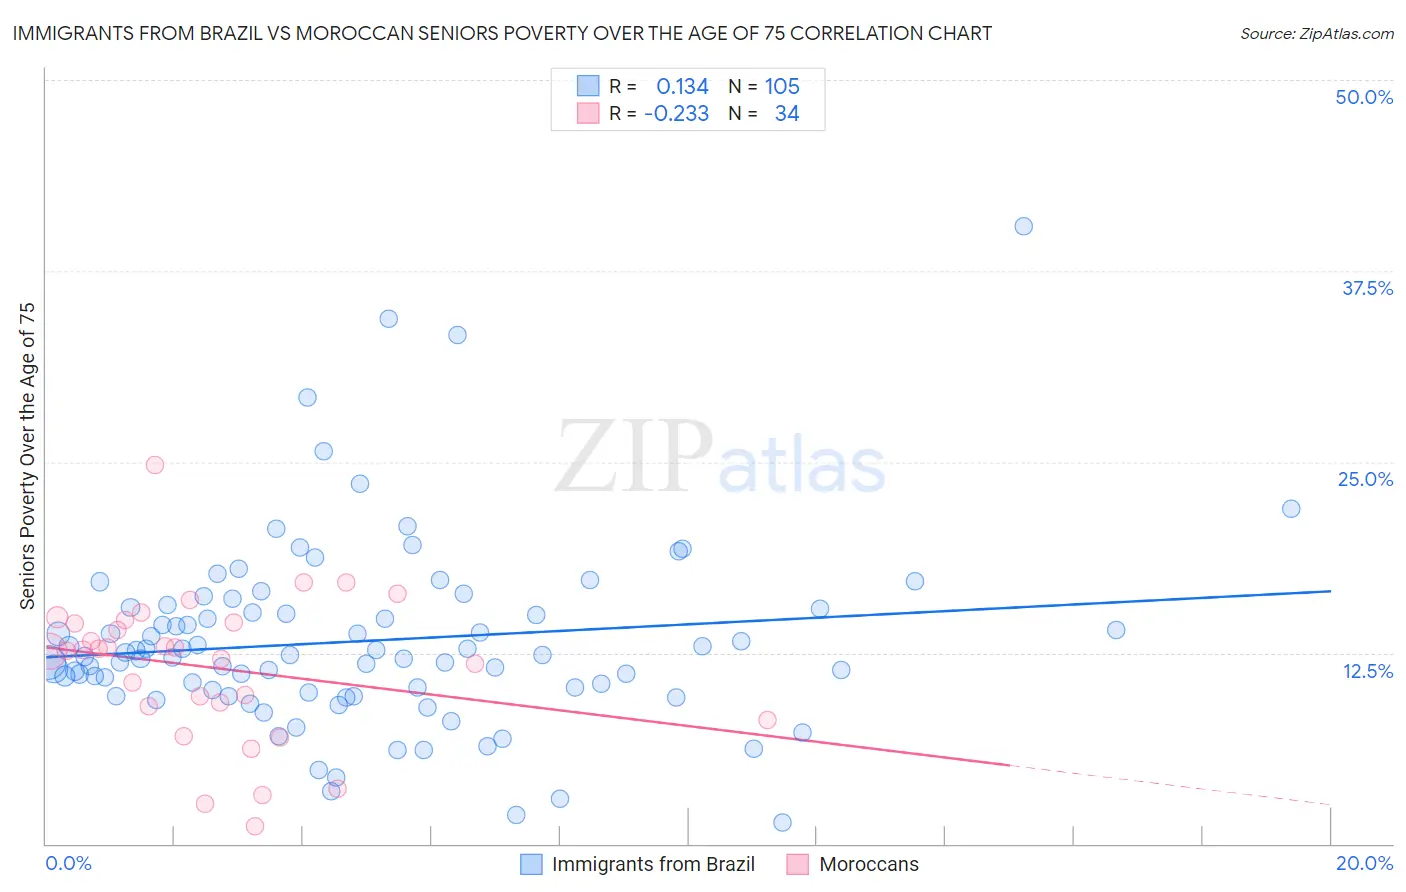
Immigrants from Brazil vs Moroccan Seniors Poverty Over the Age of 75 Correlation Chart
The statistical analysis conducted on geographies consisting of 339,635,702 people shows a poor positive correlation between the proportion of Immigrants from Brazil and poverty level among seniors over the age of 75 in the United States with a correlation coefficient (R) of 0.134 and weighted average of 12.9%. Similarly, the statistical analysis conducted on geographies consisting of 200,757,282 people shows a weak negative correlation between the proportion of Moroccans and poverty level among seniors over the age of 75 in the United States with a correlation coefficient (R) of -0.233 and weighted average of 13.3%, a difference of 3.4%.
Seniors Poverty Over the Age of 75 Correlation Summary
| Measurement | Immigrants from Brazil | Moroccan |
| Minimum | 1.4% | 1.1% |
| Maximum | 40.4% | 24.8% |
| Range | 39.1% | 23.6% |
| Mean | 13.3% | 11.5% |
| Median | 12.3% | 12.7% |
| Interquartile 25% (IQ1) | 10.0% | 9.0% |
| Interquartile 75% (IQ3) | 15.4% | 14.5% |
| Interquartile Range (IQR) | 5.5% | 5.5% |
| Standard Deviation (Sample) | 6.1% | 4.8% |
| Standard Deviation (Population) | 6.1% | 4.8% |
Demographics Similar to Immigrants from Brazil and Moroccans by Seniors Poverty Over the Age of 75
In terms of seniors poverty over the age of 75, the demographic groups most similar to Immigrants from Brazil are Bermudan (12.9%, a difference of 0.10%), Immigrants from Western Asia (12.9%, a difference of 0.12%), Ute (12.9%, a difference of 0.18%), Seminole (12.9%, a difference of 0.29%), and Immigrants from Kazakhstan (13.0%, a difference of 0.38%). Similarly, the demographic groups most similar to Moroccans are Japanese (13.3%, a difference of 0.020%), Immigrants from Israel (13.3%, a difference of 0.31%), Immigrants from Costa Rica (13.3%, a difference of 0.66%), Immigrants from Chile (13.3%, a difference of 0.69%), and Subsaharan African (13.2%, a difference of 0.89%).
| Demographics | Rating | Rank | Seniors Poverty Over the Age of 75 |
| Immigrants | Brazil | 5.2 /100 | #216 | Tragic 12.9% |
| Bermudans | 4.9 /100 | #217 | Tragic 12.9% |
| Immigrants | Western Asia | 4.9 /100 | #218 | Tragic 12.9% |
| Ute | 4.7 /100 | #219 | Tragic 12.9% |
| Seminole | 4.5 /100 | #220 | Tragic 12.9% |
| Immigrants | Kazakhstan | 4.3 /100 | #221 | Tragic 13.0% |
| Nigerians | 3.4 /100 | #222 | Tragic 13.0% |
| Immigrants | Nigeria | 3.3 /100 | #223 | Tragic 13.0% |
| Chippewa | 2.9 /100 | #224 | Tragic 13.1% |
| Immigrants | Morocco | 2.8 /100 | #225 | Tragic 13.1% |
| Shoshone | 2.6 /100 | #226 | Tragic 13.1% |
| Cree | 2.3 /100 | #227 | Tragic 13.1% |
| Israelis | 2.0 /100 | #228 | Tragic 13.2% |
| Somalis | 1.6 /100 | #229 | Tragic 13.2% |
| Immigrants | China | 1.5 /100 | #230 | Tragic 13.2% |
| Sub-Saharan Africans | 1.5 /100 | #231 | Tragic 13.2% |
| Immigrants | Chile | 1.3 /100 | #232 | Tragic 13.3% |
| Immigrants | Costa Rica | 1.3 /100 | #233 | Tragic 13.3% |
| Immigrants | Israel | 1.1 /100 | #234 | Tragic 13.3% |
| Japanese | 0.9 /100 | #235 | Tragic 13.3% |
| Moroccans | 0.9 /100 | #236 | Tragic 13.3% |