Immigrants from Brazil vs Moroccan Professional Degree
COMPARE
Immigrants from Brazil
Moroccan
Professional Degree
Professional Degree Comparison
Immigrants from Brazil
Moroccans
5.3%
PROFESSIONAL DEGREE
99.6/ 100
METRIC RATING
81st/ 347
METRIC RANK
5.0%
PROFESSIONAL DEGREE
96.8/ 100
METRIC RATING
115th/ 347
METRIC RANK
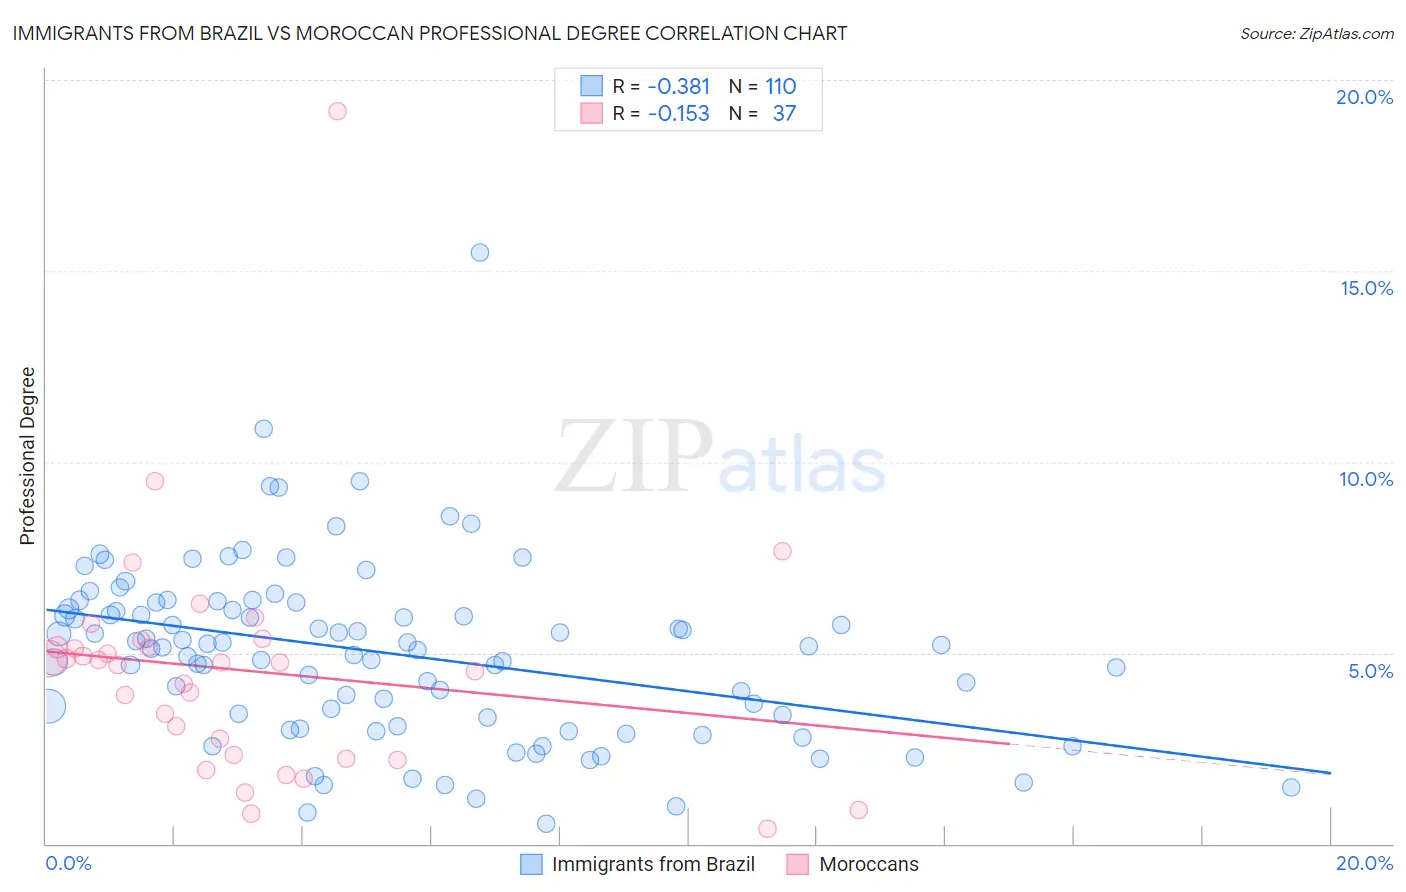
Immigrants from Brazil vs Moroccan Professional Degree Correlation Chart
The statistical analysis conducted on geographies consisting of 342,594,044 people shows a mild negative correlation between the proportion of Immigrants from Brazil and percentage of population with at least professional degree education in the United States with a correlation coefficient (R) of -0.381 and weighted average of 5.3%. Similarly, the statistical analysis conducted on geographies consisting of 201,703,459 people shows a poor negative correlation between the proportion of Moroccans and percentage of population with at least professional degree education in the United States with a correlation coefficient (R) of -0.153 and weighted average of 5.0%, a difference of 7.3%.
Professional Degree Correlation Summary
| Measurement | Immigrants from Brazil | Moroccan |
| Minimum | 0.54% | 0.40% |
| Maximum | 15.5% | 19.2% |
| Range | 15.0% | 18.8% |
| Mean | 5.0% | 4.5% |
| Median | 5.2% | 4.7% |
| Interquartile 25% (IQ1) | 3.3% | 2.3% |
| Interquartile 75% (IQ3) | 6.1% | 5.2% |
| Interquartile Range (IQR) | 2.9% | 3.0% |
| Standard Deviation (Sample) | 2.3% | 3.2% |
| Standard Deviation (Population) | 2.3% | 3.1% |
Similar Demographics by Professional Degree
Demographics Similar to Immigrants from Brazil by Professional Degree
In terms of professional degree, the demographic groups most similar to Immigrants from Brazil are Immigrants from England (5.3%, a difference of 0.010%), Immigrants from North America (5.3%, a difference of 0.40%), Romanian (5.3%, a difference of 0.50%), Armenian (5.3%, a difference of 0.57%), and Immigrants from Ethiopia (5.3%, a difference of 0.61%).
| Demographics | Rating | Rank | Professional Degree |
| Ethiopians | 99.7 /100 | #74 | Exceptional 5.4% |
| Immigrants | Indonesia | 99.7 /100 | #75 | Exceptional 5.3% |
| Immigrants | Canada | 99.7 /100 | #76 | Exceptional 5.3% |
| Immigrants | Ethiopia | 99.7 /100 | #77 | Exceptional 5.3% |
| Armenians | 99.7 /100 | #78 | Exceptional 5.3% |
| Immigrants | North America | 99.7 /100 | #79 | Exceptional 5.3% |
| Immigrants | England | 99.6 /100 | #80 | Exceptional 5.3% |
| Immigrants | Brazil | 99.6 /100 | #81 | Exceptional 5.3% |
| Romanians | 99.6 /100 | #82 | Exceptional 5.3% |
| Carpatho Rusyns | 99.6 /100 | #83 | Exceptional 5.3% |
| Immigrants | Croatia | 99.6 /100 | #84 | Exceptional 5.3% |
| Immigrants | Zimbabwe | 99.6 /100 | #85 | Exceptional 5.3% |
| Greeks | 99.6 /100 | #86 | Exceptional 5.3% |
| Immigrants | Chile | 99.5 /100 | #87 | Exceptional 5.3% |
| Egyptians | 99.5 /100 | #88 | Exceptional 5.3% |
Demographics Similar to Moroccans by Professional Degree
In terms of professional degree, the demographic groups most similar to Moroccans are Immigrants from Morocco (5.0%, a difference of 0.10%), Venezuelan (4.9%, a difference of 0.47%), Immigrants from Pakistan (5.0%, a difference of 0.55%), Taiwanese (5.0%, a difference of 0.57%), and Immigrants from Syria (4.9%, a difference of 0.68%).
| Demographics | Rating | Rank | Professional Degree |
| Immigrants | Southern Europe | 98.1 /100 | #108 | Exceptional 5.0% |
| British | 98.0 /100 | #109 | Exceptional 5.0% |
| Lebanese | 98.0 /100 | #110 | Exceptional 5.0% |
| Brazilians | 97.4 /100 | #111 | Exceptional 5.0% |
| Taiwanese | 97.3 /100 | #112 | Exceptional 5.0% |
| Immigrants | Pakistan | 97.2 /100 | #113 | Exceptional 5.0% |
| Immigrants | Morocco | 96.8 /100 | #114 | Exceptional 5.0% |
| Moroccans | 96.8 /100 | #115 | Exceptional 5.0% |
| Venezuelans | 96.3 /100 | #116 | Exceptional 4.9% |
| Immigrants | Syria | 96.0 /100 | #117 | Exceptional 4.9% |
| Croatians | 96.0 /100 | #118 | Exceptional 4.9% |
| Immigrants | Sudan | 95.4 /100 | #119 | Exceptional 4.9% |
| Albanians | 95.3 /100 | #120 | Exceptional 4.9% |
| Immigrants | Moldova | 94.8 /100 | #121 | Exceptional 4.9% |
| Immigrants | Germany | 94.1 /100 | #122 | Exceptional 4.9% |