Immigrants from Bosnia and Herzegovina vs Immigrants from Dominica Child Poverty Among Boys Under 16
COMPARE
Immigrants from Bosnia and Herzegovina
Immigrants from Dominica
Child Poverty Among Boys Under 16
Child Poverty Among Boys Under 16 Comparison
Immigrants from Bosnia and Herzegovina
Immigrants from Dominica
16.4%
CHILD POVERTY AMONG BOYS UNDER 16
51.7/ 100
METRIC RATING
170th/ 347
METRIC RANK
22.2%
CHILD POVERTY AMONG BOYS UNDER 16
0.0/ 100
METRIC RATING
322nd/ 347
METRIC RANK
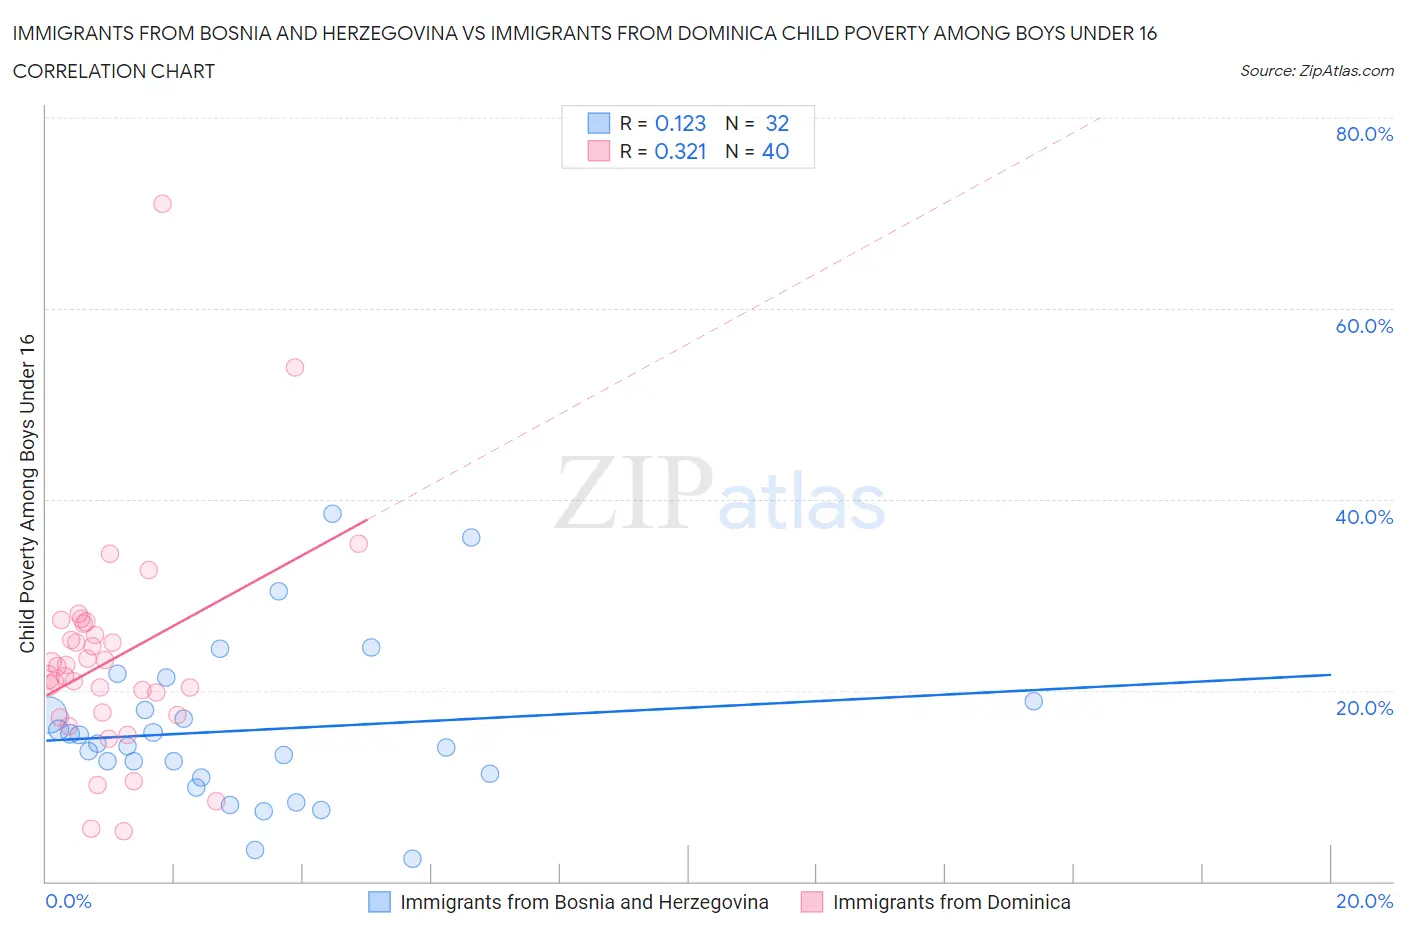
Immigrants from Bosnia and Herzegovina vs Immigrants from Dominica Child Poverty Among Boys Under 16 Correlation Chart
The statistical analysis conducted on geographies consisting of 155,858,187 people shows a poor positive correlation between the proportion of Immigrants from Bosnia and Herzegovina and poverty level among boys under the age of 16 in the United States with a correlation coefficient (R) of 0.123 and weighted average of 16.4%. Similarly, the statistical analysis conducted on geographies consisting of 83,576,138 people shows a mild positive correlation between the proportion of Immigrants from Dominica and poverty level among boys under the age of 16 in the United States with a correlation coefficient (R) of 0.321 and weighted average of 22.2%, a difference of 35.3%.
Child Poverty Among Boys Under 16 Correlation Summary
| Measurement | Immigrants from Bosnia and Herzegovina | Immigrants from Dominica |
| Minimum | 2.4% | 5.2% |
| Maximum | 38.5% | 70.9% |
| Range | 36.2% | 65.7% |
| Mean | 15.8% | 23.2% |
| Median | 14.3% | 22.0% |
| Interquartile 25% (IQ1) | 11.0% | 17.6% |
| Interquartile 75% (IQ3) | 18.4% | 26.4% |
| Interquartile Range (IQR) | 7.4% | 8.8% |
| Standard Deviation (Sample) | 8.2% | 11.6% |
| Standard Deviation (Population) | 8.1% | 11.4% |
Similar Demographics by Child Poverty Among Boys Under 16
Demographics Similar to Immigrants from Bosnia and Herzegovina by Child Poverty Among Boys Under 16
In terms of child poverty among boys under 16, the demographic groups most similar to Immigrants from Bosnia and Herzegovina are Immigrants from Ethiopia (16.4%, a difference of 0.050%), Immigrants from Colombia (16.4%, a difference of 0.11%), Tsimshian (16.4%, a difference of 0.14%), Uruguayan (16.4%, a difference of 0.19%), and Immigrants from Saudi Arabia (16.4%, a difference of 0.21%).
| Demographics | Rating | Rank | Child Poverty Among Boys Under 16 |
| Costa Ricans | 68.1 /100 | #163 | Good 16.1% |
| Immigrants | Albania | 67.9 /100 | #164 | Good 16.1% |
| Colombians | 65.2 /100 | #165 | Good 16.1% |
| Immigrants | Germany | 63.6 /100 | #166 | Good 16.2% |
| Afghans | 55.4 /100 | #167 | Average 16.3% |
| South Americans | 55.3 /100 | #168 | Average 16.3% |
| Immigrants | Saudi Arabia | 53.6 /100 | #169 | Average 16.4% |
| Immigrants | Bosnia and Herzegovina | 51.7 /100 | #170 | Average 16.4% |
| Immigrants | Ethiopia | 51.3 /100 | #171 | Average 16.4% |
| Immigrants | Colombia | 50.8 /100 | #172 | Average 16.4% |
| Tsimshian | 50.5 /100 | #173 | Average 16.4% |
| Uruguayans | 50.0 /100 | #174 | Average 16.4% |
| Immigrants | Syria | 49.0 /100 | #175 | Average 16.5% |
| Whites/Caucasians | 48.2 /100 | #176 | Average 16.5% |
| Ethiopians | 47.8 /100 | #177 | Average 16.5% |
Demographics Similar to Immigrants from Dominica by Child Poverty Among Boys Under 16
In terms of child poverty among boys under 16, the demographic groups most similar to Immigrants from Dominica are Cajun (22.2%, a difference of 0.020%), Honduran (22.3%, a difference of 0.53%), Immigrants from Congo (22.4%, a difference of 0.91%), U.S. Virgin Islander (22.0%, a difference of 0.93%), and Central American Indian (22.5%, a difference of 1.4%).
| Demographics | Rating | Rank | Child Poverty Among Boys Under 16 |
| Immigrants | Somalia | 0.0 /100 | #315 | Tragic 21.7% |
| Menominee | 0.0 /100 | #316 | Tragic 21.7% |
| Africans | 0.0 /100 | #317 | Tragic 21.7% |
| Yakama | 0.0 /100 | #318 | Tragic 21.7% |
| Dutch West Indians | 0.0 /100 | #319 | Tragic 21.8% |
| U.S. Virgin Islanders | 0.0 /100 | #320 | Tragic 22.0% |
| Cajuns | 0.0 /100 | #321 | Tragic 22.2% |
| Immigrants | Dominica | 0.0 /100 | #322 | Tragic 22.2% |
| Hondurans | 0.0 /100 | #323 | Tragic 22.3% |
| Immigrants | Congo | 0.0 /100 | #324 | Tragic 22.4% |
| Central American Indians | 0.0 /100 | #325 | Tragic 22.5% |
| Paiute | 0.0 /100 | #326 | Tragic 22.8% |
| Immigrants | Honduras | 0.0 /100 | #327 | Tragic 22.8% |
| Pueblo | 0.0 /100 | #328 | Tragic 23.5% |
| Natives/Alaskans | 0.0 /100 | #329 | Tragic 24.0% |