Colville vs Senegalese Seniors Poverty Over the Age of 75
COMPARE
Colville
Senegalese
Seniors Poverty Over the Age of 75
Seniors Poverty Over the Age of 75 Comparison
Colville
Senegalese
15.2%
SENIORS POVERTY OVER THE AGE OF 75
0.0/ 100
METRIC RATING
292nd/ 347
METRIC RANK
14.5%
SENIORS POVERTY OVER THE AGE OF 75
0.0/ 100
METRIC RATING
277th/ 347
METRIC RANK
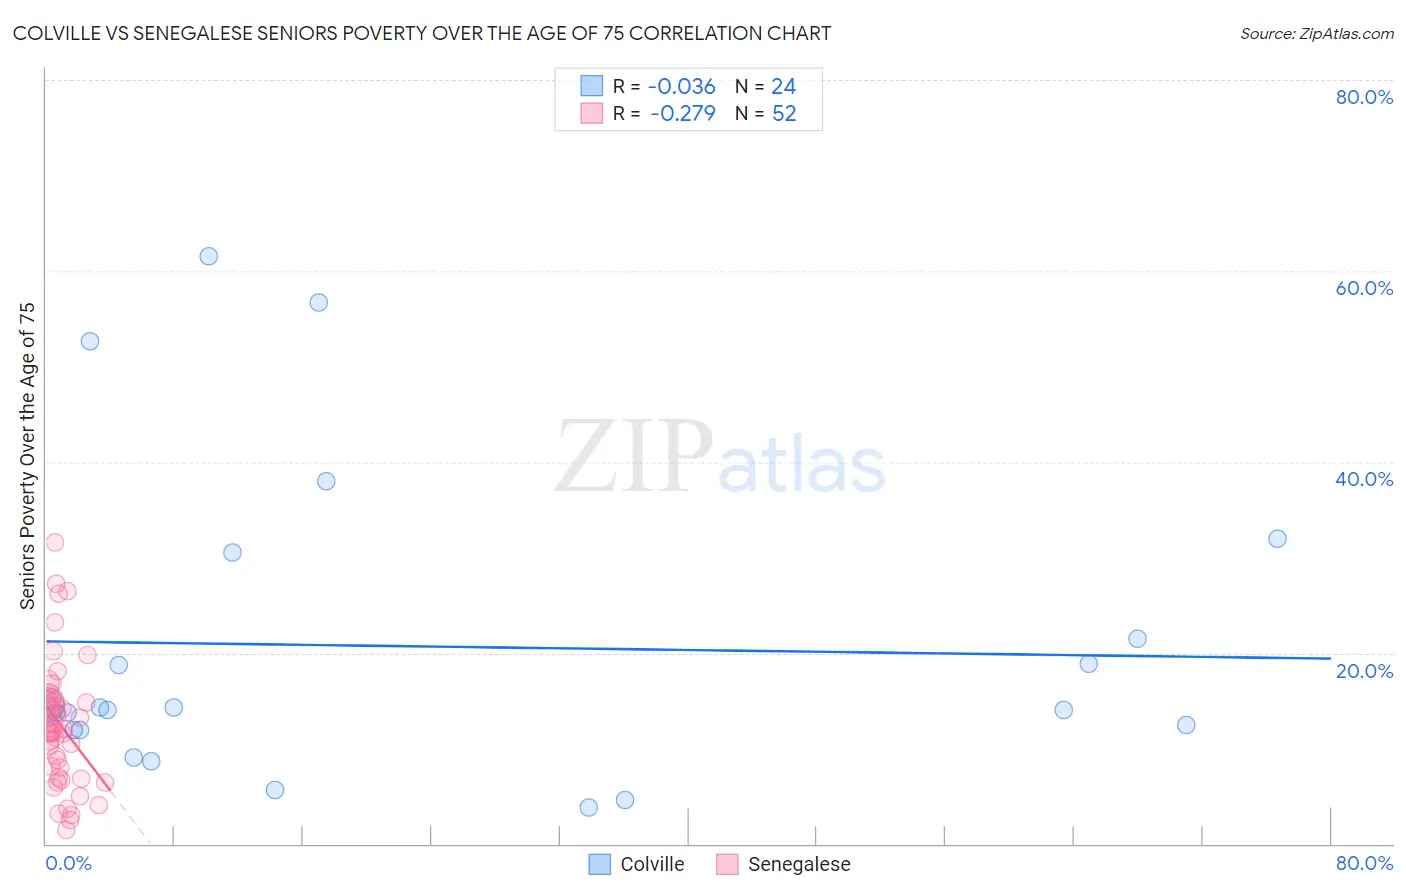
Colville vs Senegalese Seniors Poverty Over the Age of 75 Correlation Chart
The statistical analysis conducted on geographies consisting of 34,564,944 people shows no correlation between the proportion of Colville and poverty level among seniors over the age of 75 in the United States with a correlation coefficient (R) of -0.036 and weighted average of 15.2%. Similarly, the statistical analysis conducted on geographies consisting of 77,878,281 people shows a weak negative correlation between the proportion of Senegalese and poverty level among seniors over the age of 75 in the United States with a correlation coefficient (R) of -0.279 and weighted average of 14.5%, a difference of 4.9%.
Seniors Poverty Over the Age of 75 Correlation Summary
| Measurement | Colville | Senegalese |
| Minimum | 3.7% | 1.5% |
| Maximum | 61.5% | 31.6% |
| Range | 57.8% | 30.1% |
| Mean | 20.7% | 12.5% |
| Median | 14.1% | 11.9% |
| Interquartile 25% (IQ1) | 11.9% | 7.5% |
| Interquartile 75% (IQ3) | 26.0% | 14.9% |
| Interquartile Range (IQR) | 14.1% | 7.5% |
| Standard Deviation (Sample) | 16.3% | 6.6% |
| Standard Deviation (Population) | 15.9% | 6.5% |
Demographics Similar to Colville and Senegalese by Seniors Poverty Over the Age of 75
In terms of seniors poverty over the age of 75, the demographic groups most similar to Colville are Paiute (15.2%, a difference of 0.18%), Immigrants from the Azores (15.2%, a difference of 0.20%), Immigrants from Belize (15.2%, a difference of 0.22%), Apache (15.3%, a difference of 0.40%), and Jamaican (15.1%, a difference of 0.48%). Similarly, the demographic groups most similar to Senegalese are Soviet Union (14.5%, a difference of 0.27%), Immigrants from El Salvador (14.5%, a difference of 0.32%), Immigrants from Bahamas (14.4%, a difference of 0.49%), Immigrants from Colombia (14.6%, a difference of 0.77%), and Black/African American (14.6%, a difference of 0.99%).
| Demographics | Rating | Rank | Seniors Poverty Over the Age of 75 |
| Immigrants | Bahamas | 0.0 /100 | #274 | Tragic 14.4% |
| Immigrants | El Salvador | 0.0 /100 | #275 | Tragic 14.5% |
| Soviet Union | 0.0 /100 | #276 | Tragic 14.5% |
| Senegalese | 0.0 /100 | #277 | Tragic 14.5% |
| Immigrants | Colombia | 0.0 /100 | #278 | Tragic 14.6% |
| Blacks/African Americans | 0.0 /100 | #279 | Tragic 14.6% |
| Central Americans | 0.0 /100 | #280 | Tragic 14.7% |
| Belizeans | 0.0 /100 | #281 | Tragic 14.8% |
| Immigrants | Senegal | 0.0 /100 | #282 | Tragic 14.8% |
| Guatemalans | 0.0 /100 | #283 | Tragic 14.8% |
| Cheyenne | 0.0 /100 | #284 | Tragic 14.9% |
| Immigrants | Mexico | 0.0 /100 | #285 | Tragic 14.9% |
| Immigrants | Central America | 0.0 /100 | #286 | Tragic 15.0% |
| Immigrants | Guatemala | 0.0 /100 | #287 | Tragic 15.1% |
| Jamaicans | 0.0 /100 | #288 | Tragic 15.1% |
| Immigrants | Belize | 0.0 /100 | #289 | Tragic 15.2% |
| Immigrants | Azores | 0.0 /100 | #290 | Tragic 15.2% |
| Paiute | 0.0 /100 | #291 | Tragic 15.2% |
| Colville | 0.0 /100 | #292 | Tragic 15.2% |
| Apache | 0.0 /100 | #293 | Tragic 15.3% |
| Immigrants | Jamaica | 0.0 /100 | #294 | Tragic 15.3% |