Immigrants from Belarus vs Slovene Poverty
COMPARE
Immigrants from Belarus
Slovene
Poverty
Poverty Comparison
Immigrants from Belarus
Slovenes
11.6%
POVERTY
90.8/ 100
METRIC RATING
113th/ 347
METRIC RANK
11.0%
POVERTY
98.9/ 100
METRIC RATING
48th/ 347
METRIC RANK
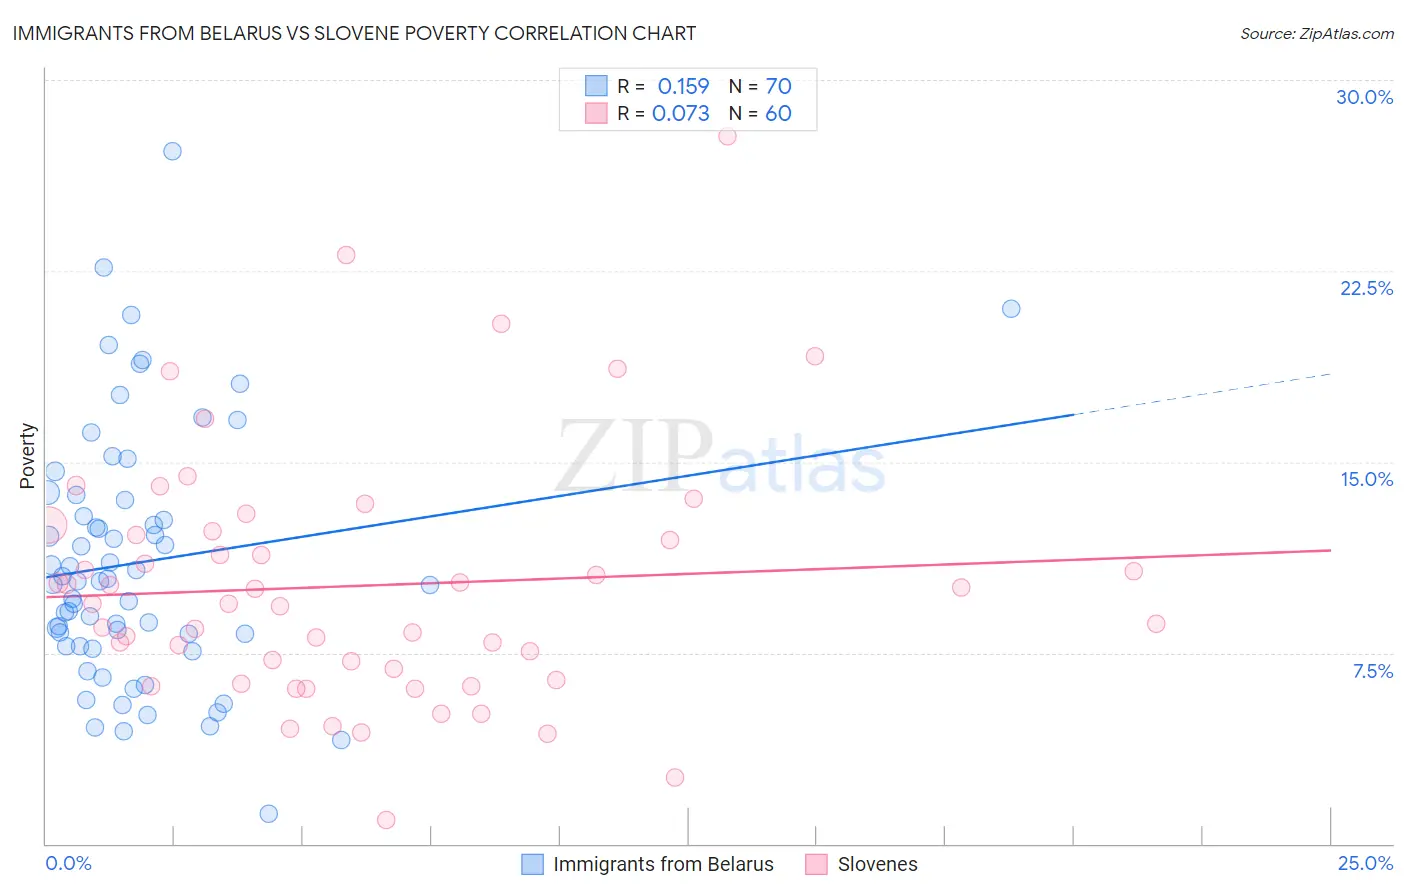
Immigrants from Belarus vs Slovene Poverty Correlation Chart
The statistical analysis conducted on geographies consisting of 150,136,945 people shows a poor positive correlation between the proportion of Immigrants from Belarus and poverty level in the United States with a correlation coefficient (R) of 0.159 and weighted average of 11.6%. Similarly, the statistical analysis conducted on geographies consisting of 261,264,546 people shows a slight positive correlation between the proportion of Slovenes and poverty level in the United States with a correlation coefficient (R) of 0.073 and weighted average of 11.0%, a difference of 6.0%.
Poverty Correlation Summary
| Measurement | Immigrants from Belarus | Slovene |
| Minimum | 1.2% | 0.91% |
| Maximum | 27.2% | 27.8% |
| Range | 26.0% | 26.9% |
| Mean | 11.1% | 10.1% |
| Median | 10.3% | 9.4% |
| Interquartile 25% (IQ1) | 7.7% | 6.6% |
| Interquartile 75% (IQ3) | 13.5% | 12.2% |
| Interquartile Range (IQR) | 5.8% | 5.6% |
| Standard Deviation (Sample) | 5.0% | 5.0% |
| Standard Deviation (Population) | 4.9% | 4.9% |
Similar Demographics by Poverty
Demographics Similar to Immigrants from Belarus by Poverty
In terms of poverty, the demographic groups most similar to Immigrants from Belarus are Immigrants from Southern Europe (11.6%, a difference of 0.0%), Immigrants from China (11.6%, a difference of 0.020%), French Canadian (11.6%, a difference of 0.070%), Albanian (11.7%, a difference of 0.16%), and Welsh (11.6%, a difference of 0.24%).
| Demographics | Rating | Rank | Poverty |
| Immigrants | Zimbabwe | 92.1 /100 | #106 | Exceptional 11.6% |
| Palestinians | 91.8 /100 | #107 | Exceptional 11.6% |
| Canadians | 91.7 /100 | #108 | Exceptional 11.6% |
| Immigrants | Turkey | 91.7 /100 | #109 | Exceptional 11.6% |
| Welsh | 91.6 /100 | #110 | Exceptional 11.6% |
| French Canadians | 91.0 /100 | #111 | Exceptional 11.6% |
| Immigrants | Southern Europe | 90.8 /100 | #112 | Exceptional 11.6% |
| Immigrants | Belarus | 90.8 /100 | #113 | Exceptional 11.6% |
| Immigrants | China | 90.7 /100 | #114 | Exceptional 11.6% |
| Albanians | 90.3 /100 | #115 | Exceptional 11.7% |
| Immigrants | Russia | 89.7 /100 | #116 | Excellent 11.7% |
| Sri Lankans | 89.4 /100 | #117 | Excellent 11.7% |
| Argentineans | 89.1 /100 | #118 | Excellent 11.7% |
| Tlingit-Haida | 89.0 /100 | #119 | Excellent 11.7% |
| Immigrants | South Eastern Asia | 88.9 /100 | #120 | Excellent 11.7% |
Demographics Similar to Slovenes by Poverty
In terms of poverty, the demographic groups most similar to Slovenes are Immigrants from Japan (11.0%, a difference of 0.010%), Asian (11.0%, a difference of 0.040%), Immigrants from Romania (11.0%, a difference of 0.050%), Immigrants from Czechoslovakia (11.0%, a difference of 0.060%), and Turkish (11.0%, a difference of 0.14%).
| Demographics | Rating | Rank | Poverty |
| Immigrants | Iran | 99.2 /100 | #41 | Exceptional 10.9% |
| Koreans | 99.2 /100 | #42 | Exceptional 10.9% |
| Immigrants | Singapore | 99.2 /100 | #43 | Exceptional 10.9% |
| Immigrants | Moldova | 99.1 /100 | #44 | Exceptional 10.9% |
| Turks | 98.9 /100 | #45 | Exceptional 11.0% |
| Immigrants | Czechoslovakia | 98.9 /100 | #46 | Exceptional 11.0% |
| Immigrants | Romania | 98.9 /100 | #47 | Exceptional 11.0% |
| Slovenes | 98.9 /100 | #48 | Exceptional 11.0% |
| Immigrants | Japan | 98.9 /100 | #49 | Exceptional 11.0% |
| Asians | 98.9 /100 | #50 | Exceptional 11.0% |
| Immigrants | Croatia | 98.7 /100 | #51 | Exceptional 11.0% |
| Immigrants | Philippines | 98.7 /100 | #52 | Exceptional 11.0% |
| Immigrants | Austria | 98.6 /100 | #53 | Exceptional 11.1% |
| Immigrants | Bulgaria | 98.5 /100 | #54 | Exceptional 11.1% |
| Immigrants | Serbia | 98.5 /100 | #55 | Exceptional 11.1% |