Immigrants from Barbados vs Immigrants from Saudi Arabia Single Female Poverty
COMPARE
Immigrants from Barbados
Immigrants from Saudi Arabia
Single Female Poverty
Single Female Poverty Comparison
Immigrants from Barbados
Immigrants from Saudi Arabia
21.7%
SINGLE FEMALE POVERTY
12.2/ 100
METRIC RATING
216th/ 347
METRIC RANK
21.3%
SINGLE FEMALE POVERTY
27.1/ 100
METRIC RATING
196th/ 347
METRIC RANK
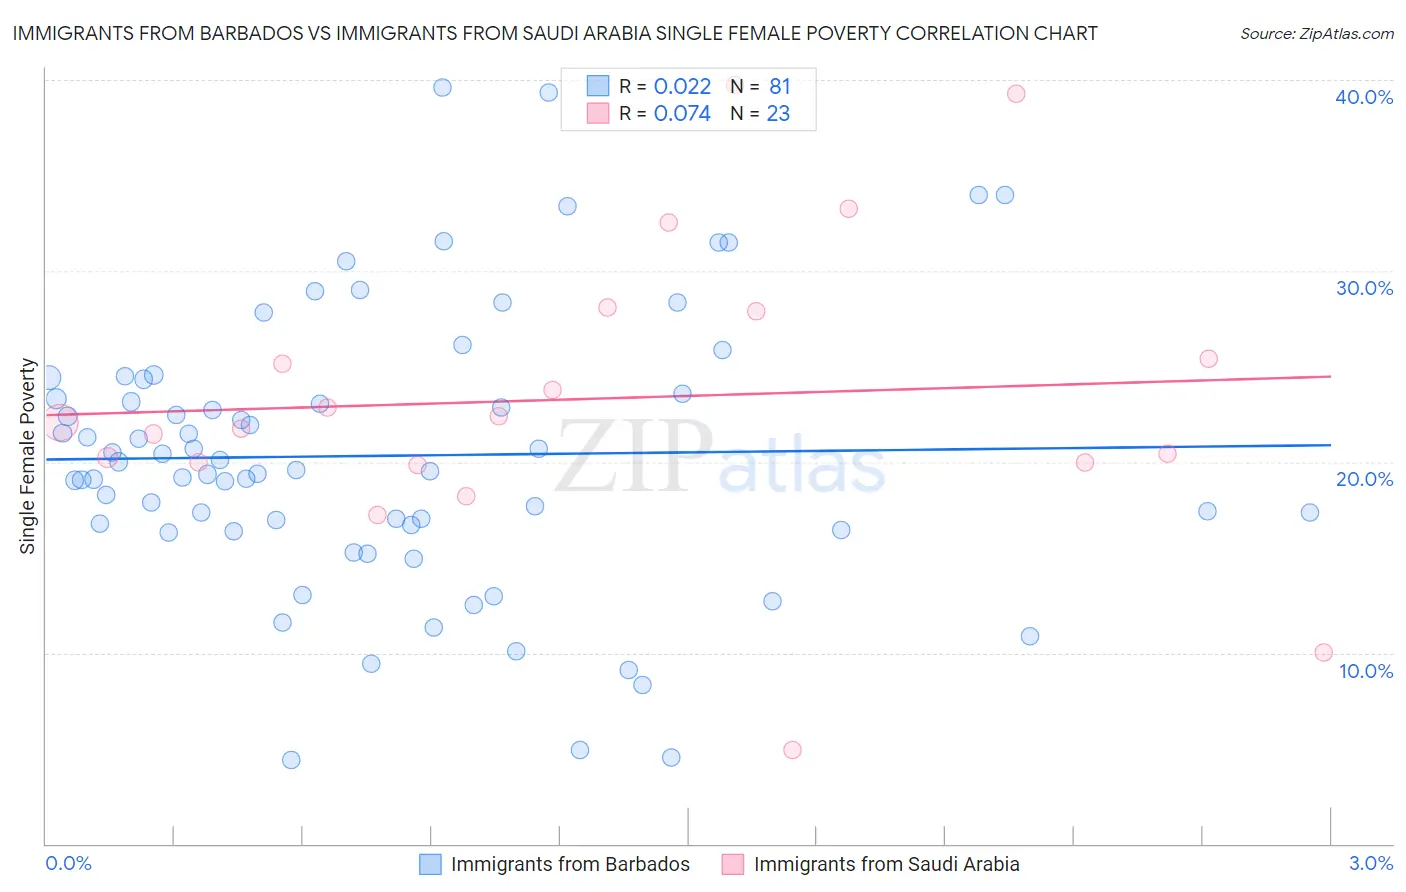
Immigrants from Barbados vs Immigrants from Saudi Arabia Single Female Poverty Correlation Chart
The statistical analysis conducted on geographies consisting of 112,301,786 people shows no correlation between the proportion of Immigrants from Barbados and poverty level among single females in the United States with a correlation coefficient (R) of 0.022 and weighted average of 21.7%. Similarly, the statistical analysis conducted on geographies consisting of 163,330,182 people shows a slight positive correlation between the proportion of Immigrants from Saudi Arabia and poverty level among single females in the United States with a correlation coefficient (R) of 0.074 and weighted average of 21.3%, a difference of 1.5%.
Single Female Poverty Correlation Summary
| Measurement | Immigrants from Barbados | Immigrants from Saudi Arabia |
| Minimum | 4.4% | 4.9% |
| Maximum | 39.6% | 39.7% |
| Range | 35.2% | 34.8% |
| Mean | 20.3% | 23.3% |
| Median | 19.5% | 22.0% |
| Interquartile 25% (IQ1) | 16.5% | 20.0% |
| Interquartile 75% (IQ3) | 24.0% | 27.9% |
| Interquartile Range (IQR) | 7.4% | 7.9% |
| Standard Deviation (Sample) | 7.3% | 8.0% |
| Standard Deviation (Population) | 7.2% | 7.8% |
Demographics Similar to Immigrants from Barbados and Immigrants from Saudi Arabia by Single Female Poverty
In terms of single female poverty, the demographic groups most similar to Immigrants from Barbados are Ecuadorian (21.6%, a difference of 0.020%), Immigrants from Nicaragua (21.6%, a difference of 0.15%), Guamanian/Chamorro (21.6%, a difference of 0.21%), Jamaican (21.6%, a difference of 0.24%), and Icelander (21.6%, a difference of 0.25%). Similarly, the demographic groups most similar to Immigrants from Saudi Arabia are Japanese (21.3%, a difference of 0.060%), Swiss (21.4%, a difference of 0.23%), Immigrants (21.4%, a difference of 0.43%), Irish (21.4%, a difference of 0.48%), and Nigerian (21.4%, a difference of 0.52%).
| Demographics | Rating | Rank | Single Female Poverty |
| Immigrants | Saudi Arabia | 27.1 /100 | #196 | Fair 21.3% |
| Japanese | 26.4 /100 | #197 | Fair 21.3% |
| Swiss | 24.2 /100 | #198 | Fair 21.4% |
| Immigrants | Immigrants | 22.0 /100 | #199 | Fair 21.4% |
| Irish | 21.4 /100 | #200 | Fair 21.4% |
| Nigerians | 20.9 /100 | #201 | Fair 21.4% |
| Immigrants | Kenya | 20.7 /100 | #202 | Fair 21.4% |
| Immigrants | Haiti | 18.8 /100 | #203 | Poor 21.5% |
| Immigrants | Africa | 16.7 /100 | #204 | Poor 21.5% |
| Finns | 16.2 /100 | #205 | Poor 21.5% |
| Belgians | 16.1 /100 | #206 | Poor 21.5% |
| Ghanaians | 15.7 /100 | #207 | Poor 21.6% |
| Haitians | 15.4 /100 | #208 | Poor 21.6% |
| Immigrants | Eastern Africa | 15.1 /100 | #209 | Poor 21.6% |
| Immigrants | Panama | 14.4 /100 | #210 | Poor 21.6% |
| Icelanders | 14.0 /100 | #211 | Poor 21.6% |
| Jamaicans | 14.0 /100 | #212 | Poor 21.6% |
| Guamanians/Chamorros | 13.7 /100 | #213 | Poor 21.6% |
| Immigrants | Nicaragua | 13.3 /100 | #214 | Poor 21.6% |
| Ecuadorians | 12.3 /100 | #215 | Poor 21.6% |
| Immigrants | Barbados | 12.2 /100 | #216 | Poor 21.7% |