Immigrants from the Azores vs Immigrants from Uruguay Female Poverty Among 25-34 Year Olds
COMPARE
Immigrants from the Azores
Immigrants from Uruguay
Female Poverty Among 25-34 Year Olds
Female Poverty Among 25-34 Year Olds Comparison
Immigrants from the Azores
Immigrants from Uruguay
15.8%
FEMALE POVERTY AMONG 25-34 YEAR OLDS
0.0/ 100
METRIC RATING
275th/ 347
METRIC RANK
13.7%
FEMALE POVERTY AMONG 25-34 YEAR OLDS
34.1/ 100
METRIC RATING
186th/ 347
METRIC RANK
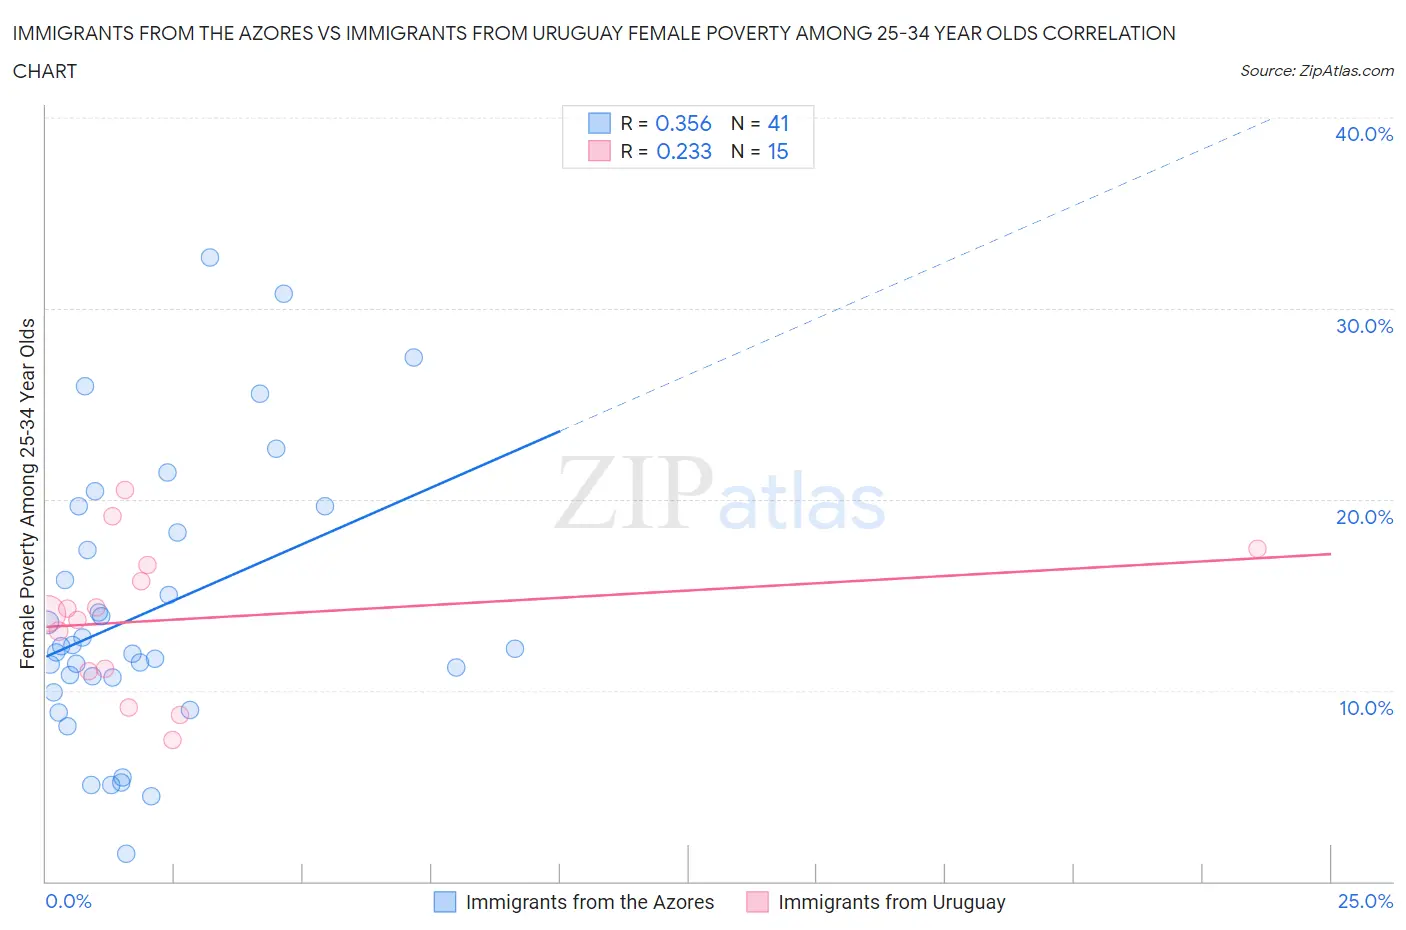
Immigrants from the Azores vs Immigrants from Uruguay Female Poverty Among 25-34 Year Olds Correlation Chart
The statistical analysis conducted on geographies consisting of 45,939,662 people shows a mild positive correlation between the proportion of Immigrants from the Azores and poverty level among females between the ages 25 and 34 in the United States with a correlation coefficient (R) of 0.356 and weighted average of 15.8%. Similarly, the statistical analysis conducted on geographies consisting of 132,376,140 people shows a weak positive correlation between the proportion of Immigrants from Uruguay and poverty level among females between the ages 25 and 34 in the United States with a correlation coefficient (R) of 0.233 and weighted average of 13.7%, a difference of 15.0%.
Female Poverty Among 25-34 Year Olds Correlation Summary
| Measurement | Immigrants from the Azores | Immigrants from Uruguay |
| Minimum | 1.5% | 7.4% |
| Maximum | 32.6% | 20.5% |
| Range | 31.2% | 13.1% |
| Mean | 14.1% | 13.7% |
| Median | 12.2% | 14.0% |
| Interquartile 25% (IQ1) | 10.3% | 11.0% |
| Interquartile 75% (IQ3) | 19.0% | 16.6% |
| Interquartile Range (IQR) | 8.7% | 5.6% |
| Standard Deviation (Sample) | 7.3% | 3.8% |
| Standard Deviation (Population) | 7.2% | 3.7% |
Similar Demographics by Female Poverty Among 25-34 Year Olds
Demographics Similar to Immigrants from the Azores by Female Poverty Among 25-34 Year Olds
In terms of female poverty among 25-34 year olds, the demographic groups most similar to Immigrants from the Azores are Immigrants from Caribbean (15.7%, a difference of 0.35%), Immigrants from Zaire (15.8%, a difference of 0.42%), Immigrants from Micronesia (15.8%, a difference of 0.44%), French American Indian (15.9%, a difference of 0.72%), and Fijian (15.9%, a difference of 0.73%).
| Demographics | Rating | Rank | Female Poverty Among 25-34 Year Olds |
| Immigrants | Senegal | 0.1 /100 | #268 | Tragic 15.6% |
| Sub-Saharan Africans | 0.1 /100 | #269 | Tragic 15.6% |
| British West Indians | 0.1 /100 | #270 | Tragic 15.6% |
| Cree | 0.1 /100 | #271 | Tragic 15.6% |
| Senegalese | 0.1 /100 | #272 | Tragic 15.6% |
| Immigrants | Nonimmigrants | 0.1 /100 | #273 | Tragic 15.6% |
| Immigrants | Caribbean | 0.0 /100 | #274 | Tragic 15.7% |
| Immigrants | Azores | 0.0 /100 | #275 | Tragic 15.8% |
| Immigrants | Zaire | 0.0 /100 | #276 | Tragic 15.8% |
| Immigrants | Micronesia | 0.0 /100 | #277 | Tragic 15.8% |
| French American Indians | 0.0 /100 | #278 | Tragic 15.9% |
| Fijians | 0.0 /100 | #279 | Tragic 15.9% |
| Bangladeshis | 0.0 /100 | #280 | Tragic 15.9% |
| Immigrants | Latin America | 0.0 /100 | #281 | Tragic 16.0% |
| Aleuts | 0.0 /100 | #282 | Tragic 16.1% |
Demographics Similar to Immigrants from Uruguay by Female Poverty Among 25-34 Year Olds
In terms of female poverty among 25-34 year olds, the demographic groups most similar to Immigrants from Uruguay are Slovak (13.7%, a difference of 0.0%), Irish (13.7%, a difference of 0.11%), Immigrants from Eritrea (13.7%, a difference of 0.13%), Finnish (13.7%, a difference of 0.15%), and Czechoslovakian (13.7%, a difference of 0.24%).
| Demographics | Rating | Rank | Female Poverty Among 25-34 Year Olds |
| Immigrants | Eastern Africa | 43.6 /100 | #179 | Average 13.6% |
| Germans | 41.6 /100 | #180 | Average 13.6% |
| Guamanians/Chamorros | 41.5 /100 | #181 | Average 13.6% |
| Immigrants | Venezuela | 40.7 /100 | #182 | Average 13.6% |
| Portuguese | 40.3 /100 | #183 | Average 13.6% |
| Czechoslovakians | 36.8 /100 | #184 | Fair 13.7% |
| Irish | 35.3 /100 | #185 | Fair 13.7% |
| Immigrants | Uruguay | 34.1 /100 | #186 | Fair 13.7% |
| Slovaks | 34.1 /100 | #187 | Fair 13.7% |
| Immigrants | Eritrea | 32.7 /100 | #188 | Fair 13.7% |
| Finns | 32.5 /100 | #189 | Fair 13.7% |
| Dutch | 29.7 /100 | #190 | Fair 13.8% |
| Immigrants | St. Vincent and the Grenadines | 29.3 /100 | #191 | Fair 13.8% |
| Tlingit-Haida | 28.1 /100 | #192 | Fair 13.8% |
| Immigrants | Kenya | 28.0 /100 | #193 | Fair 13.8% |