Immigrants from the Azores vs Portuguese Seniors Poverty Over the Age of 75
COMPARE
Immigrants from the Azores
Portuguese
Seniors Poverty Over the Age of 75
Seniors Poverty Over the Age of 75 Comparison
Immigrants from the Azores
Portuguese
15.2%
SENIORS POVERTY OVER THE AGE OF 75
0.0/ 100
METRIC RATING
290th/ 347
METRIC RANK
12.1%
SENIORS POVERTY OVER THE AGE OF 75
61.3/ 100
METRIC RATING
158th/ 347
METRIC RANK
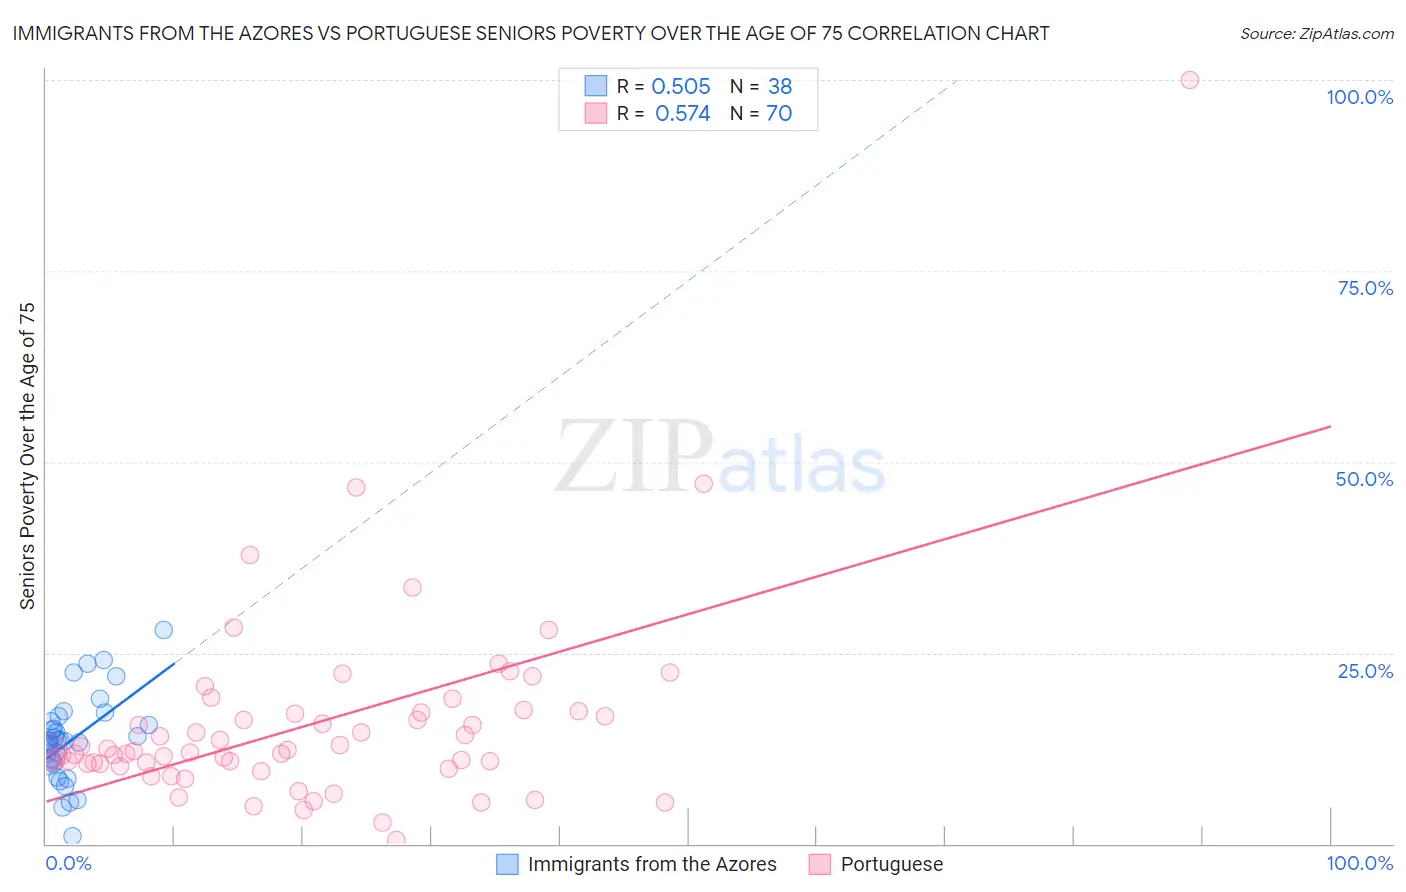
Immigrants from the Azores vs Portuguese Seniors Poverty Over the Age of 75 Correlation Chart
The statistical analysis conducted on geographies consisting of 46,090,908 people shows a substantial positive correlation between the proportion of Immigrants from the Azores and poverty level among seniors over the age of 75 in the United States with a correlation coefficient (R) of 0.505 and weighted average of 15.2%. Similarly, the statistical analysis conducted on geographies consisting of 442,883,774 people shows a substantial positive correlation between the proportion of Portuguese and poverty level among seniors over the age of 75 in the United States with a correlation coefficient (R) of 0.574 and weighted average of 12.1%, a difference of 25.8%.
Seniors Poverty Over the Age of 75 Correlation Summary
| Measurement | Immigrants from the Azores | Portuguese |
| Minimum | 0.91% | 0.48% |
| Maximum | 28.0% | 100.0% |
| Range | 27.1% | 99.5% |
| Mean | 13.6% | 15.8% |
| Median | 13.4% | 12.2% |
| Interquartile 25% (IQ1) | 10.5% | 10.5% |
| Interquartile 75% (IQ3) | 16.0% | 17.1% |
| Interquartile Range (IQR) | 5.5% | 6.7% |
| Standard Deviation (Sample) | 5.6% | 13.4% |
| Standard Deviation (Population) | 5.6% | 13.3% |
Similar Demographics by Seniors Poverty Over the Age of 75
Demographics Similar to Immigrants from the Azores by Seniors Poverty Over the Age of 75
In terms of seniors poverty over the age of 75, the demographic groups most similar to Immigrants from the Azores are Immigrants from Belize (15.2%, a difference of 0.020%), Paiute (15.2%, a difference of 0.020%), Colville (15.2%, a difference of 0.20%), Jamaican (15.1%, a difference of 0.28%), and Apache (15.3%, a difference of 0.60%).
| Demographics | Rating | Rank | Seniors Poverty Over the Age of 75 |
| Guatemalans | 0.0 /100 | #283 | Tragic 14.8% |
| Cheyenne | 0.0 /100 | #284 | Tragic 14.9% |
| Immigrants | Mexico | 0.0 /100 | #285 | Tragic 14.9% |
| Immigrants | Central America | 0.0 /100 | #286 | Tragic 15.0% |
| Immigrants | Guatemala | 0.0 /100 | #287 | Tragic 15.1% |
| Jamaicans | 0.0 /100 | #288 | Tragic 15.1% |
| Immigrants | Belize | 0.0 /100 | #289 | Tragic 15.2% |
| Immigrants | Azores | 0.0 /100 | #290 | Tragic 15.2% |
| Paiute | 0.0 /100 | #291 | Tragic 15.2% |
| Colville | 0.0 /100 | #292 | Tragic 15.2% |
| Apache | 0.0 /100 | #293 | Tragic 15.3% |
| Immigrants | Jamaica | 0.0 /100 | #294 | Tragic 15.3% |
| U.S. Virgin Islanders | 0.0 /100 | #295 | Tragic 15.4% |
| Yuman | 0.0 /100 | #296 | Tragic 15.4% |
| Hondurans | 0.0 /100 | #297 | Tragic 15.4% |
Demographics Similar to Portuguese by Seniors Poverty Over the Age of 75
In terms of seniors poverty over the age of 75, the demographic groups most similar to Portuguese are Immigrants from Middle Africa (12.1%, a difference of 0.010%), Immigrants from Eastern Africa (12.1%, a difference of 0.030%), Immigrants from Sudan (12.1%, a difference of 0.040%), Immigrants from Norway (12.1%, a difference of 0.060%), and Immigrants from Burma/Myanmar (12.1%, a difference of 0.090%).
| Demographics | Rating | Rank | Seniors Poverty Over the Age of 75 |
| Cherokee | 65.8 /100 | #151 | Good 12.0% |
| Immigrants | Korea | 65.5 /100 | #152 | Good 12.0% |
| Immigrants | Turkey | 64.7 /100 | #153 | Good 12.0% |
| Cambodians | 64.0 /100 | #154 | Good 12.0% |
| Indonesians | 62.6 /100 | #155 | Good 12.1% |
| Immigrants | Burma/Myanmar | 62.3 /100 | #156 | Good 12.1% |
| Immigrants | Sudan | 61.7 /100 | #157 | Good 12.1% |
| Portuguese | 61.3 /100 | #158 | Good 12.1% |
| Immigrants | Middle Africa | 61.2 /100 | #159 | Good 12.1% |
| Immigrants | Eastern Africa | 60.9 /100 | #160 | Good 12.1% |
| Immigrants | Norway | 60.6 /100 | #161 | Good 12.1% |
| Immigrants | Serbia | 60.2 /100 | #162 | Good 12.1% |
| Immigrants | Greece | 58.2 /100 | #163 | Average 12.1% |
| Potawatomi | 57.4 /100 | #164 | Average 12.1% |
| Okinawans | 56.3 /100 | #165 | Average 12.1% |