Immigrants from Austria vs Nigerian Child Poverty Among Boys Under 16
COMPARE
Immigrants from Austria
Nigerian
Child Poverty Among Boys Under 16
Child Poverty Among Boys Under 16 Comparison
Immigrants from Austria
Nigerians
14.5%
CHILD POVERTY AMONG BOYS UNDER 16
98.4/ 100
METRIC RATING
69th/ 347
METRIC RANK
18.5%
CHILD POVERTY AMONG BOYS UNDER 16
1.1/ 100
METRIC RATING
234th/ 347
METRIC RANK
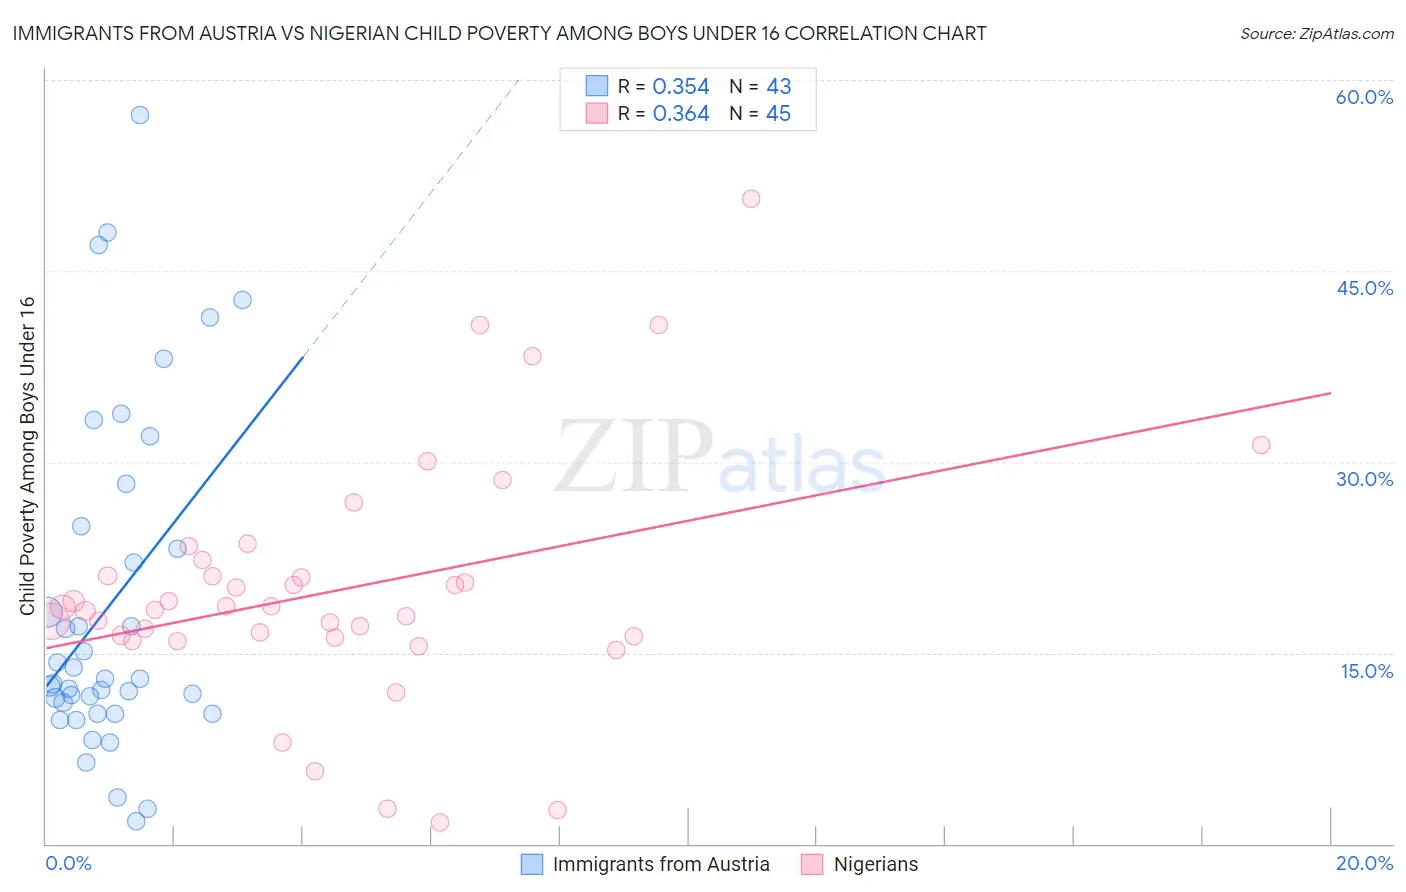
Immigrants from Austria vs Nigerian Child Poverty Among Boys Under 16 Correlation Chart
The statistical analysis conducted on geographies consisting of 165,951,164 people shows a mild positive correlation between the proportion of Immigrants from Austria and poverty level among boys under the age of 16 in the United States with a correlation coefficient (R) of 0.354 and weighted average of 14.5%. Similarly, the statistical analysis conducted on geographies consisting of 329,481,390 people shows a mild positive correlation between the proportion of Nigerians and poverty level among boys under the age of 16 in the United States with a correlation coefficient (R) of 0.364 and weighted average of 18.5%, a difference of 27.1%.
Child Poverty Among Boys Under 16 Correlation Summary
| Measurement | Immigrants from Austria | Nigerian |
| Minimum | 1.7% | 1.7% |
| Maximum | 57.2% | 50.6% |
| Range | 55.5% | 48.9% |
| Mean | 18.8% | 19.9% |
| Median | 12.9% | 18.6% |
| Interquartile 25% (IQ1) | 10.3% | 16.2% |
| Interquartile 75% (IQ3) | 25.0% | 21.6% |
| Interquartile Range (IQR) | 14.7% | 5.4% |
| Standard Deviation (Sample) | 13.4% | 9.6% |
| Standard Deviation (Population) | 13.2% | 9.5% |
Similar Demographics by Child Poverty Among Boys Under 16
Demographics Similar to Immigrants from Austria by Child Poverty Among Boys Under 16
In terms of child poverty among boys under 16, the demographic groups most similar to Immigrants from Austria are European (14.5%, a difference of 0.0%), Slovene (14.5%, a difference of 0.030%), Immigrants from Europe (14.5%, a difference of 0.12%), Immigrants from Bulgaria (14.5%, a difference of 0.15%), and Soviet Union (14.5%, a difference of 0.16%).
| Demographics | Rating | Rank | Child Poverty Among Boys Under 16 |
| Immigrants | Israel | 98.7 /100 | #62 | Exceptional 14.4% |
| Cambodians | 98.5 /100 | #63 | Exceptional 14.5% |
| Immigrants | Romania | 98.5 /100 | #64 | Exceptional 14.5% |
| Soviet Union | 98.5 /100 | #65 | Exceptional 14.5% |
| Immigrants | Bulgaria | 98.5 /100 | #66 | Exceptional 14.5% |
| Immigrants | Europe | 98.4 /100 | #67 | Exceptional 14.5% |
| Slovenes | 98.4 /100 | #68 | Exceptional 14.5% |
| Immigrants | Austria | 98.4 /100 | #69 | Exceptional 14.5% |
| Europeans | 98.4 /100 | #70 | Exceptional 14.5% |
| Immigrants | Netherlands | 98.1 /100 | #71 | Exceptional 14.6% |
| Immigrants | Latvia | 98.1 /100 | #72 | Exceptional 14.6% |
| Immigrants | Turkey | 98.0 /100 | #73 | Exceptional 14.6% |
| Australians | 98.0 /100 | #74 | Exceptional 14.7% |
| Immigrants | Poland | 97.9 /100 | #75 | Exceptional 14.7% |
| Immigrants | Croatia | 97.9 /100 | #76 | Exceptional 14.7% |
Demographics Similar to Nigerians by Child Poverty Among Boys Under 16
In terms of child poverty among boys under 16, the demographic groups most similar to Nigerians are Immigrants from Nigeria (18.4%, a difference of 0.25%), Marshallese (18.4%, a difference of 0.44%), American (18.6%, a difference of 0.50%), Sudanese (18.6%, a difference of 0.59%), and Nicaraguan (18.4%, a difference of 0.64%).
| Demographics | Rating | Rank | Child Poverty Among Boys Under 16 |
| Bermudans | 2.5 /100 | #227 | Tragic 18.1% |
| Immigrants | Nonimmigrants | 2.2 /100 | #228 | Tragic 18.2% |
| Immigrants | Micronesia | 1.8 /100 | #229 | Tragic 18.3% |
| Fijians | 1.8 /100 | #230 | Tragic 18.3% |
| Nicaraguans | 1.4 /100 | #231 | Tragic 18.4% |
| Marshallese | 1.3 /100 | #232 | Tragic 18.4% |
| Immigrants | Nigeria | 1.2 /100 | #233 | Tragic 18.4% |
| Nigerians | 1.1 /100 | #234 | Tragic 18.5% |
| Americans | 0.9 /100 | #235 | Tragic 18.6% |
| Sudanese | 0.9 /100 | #236 | Tragic 18.6% |
| Immigrants | Eritrea | 0.8 /100 | #237 | Tragic 18.6% |
| Immigrants | Laos | 0.8 /100 | #238 | Tragic 18.7% |
| Cape Verdeans | 0.7 /100 | #239 | Tragic 18.7% |
| Immigrants | Cuba | 0.6 /100 | #240 | Tragic 18.8% |
| Immigrants | Sudan | 0.6 /100 | #241 | Tragic 18.8% |