Immigrants from Japan vs Nigerian Child Poverty Among Boys Under 16
COMPARE
Immigrants from Japan
Nigerian
Child Poverty Among Boys Under 16
Child Poverty Among Boys Under 16 Comparison
Immigrants from Japan
Nigerians
13.1%
CHILD POVERTY AMONG BOYS UNDER 16
99.9/ 100
METRIC RATING
15th/ 347
METRIC RANK
18.5%
CHILD POVERTY AMONG BOYS UNDER 16
1.1/ 100
METRIC RATING
234th/ 347
METRIC RANK
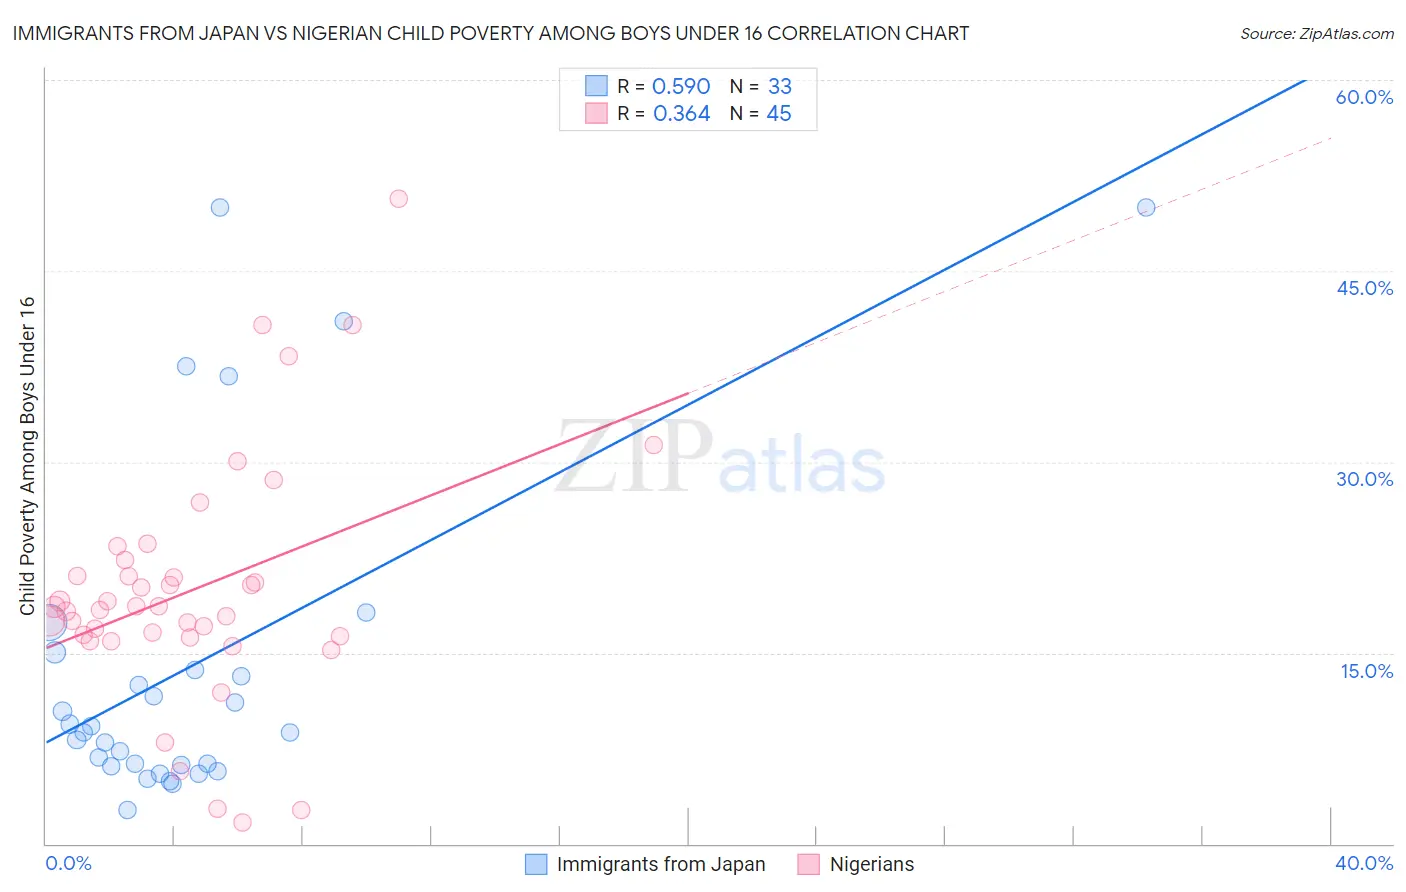
Immigrants from Japan vs Nigerian Child Poverty Among Boys Under 16 Correlation Chart
The statistical analysis conducted on geographies consisting of 335,425,883 people shows a substantial positive correlation between the proportion of Immigrants from Japan and poverty level among boys under the age of 16 in the United States with a correlation coefficient (R) of 0.590 and weighted average of 13.1%. Similarly, the statistical analysis conducted on geographies consisting of 329,481,390 people shows a mild positive correlation between the proportion of Nigerians and poverty level among boys under the age of 16 in the United States with a correlation coefficient (R) of 0.364 and weighted average of 18.5%, a difference of 40.8%.
Child Poverty Among Boys Under 16 Correlation Summary
| Measurement | Immigrants from Japan | Nigerian |
| Minimum | 2.6% | 1.7% |
| Maximum | 50.0% | 50.6% |
| Range | 47.4% | 48.9% |
| Mean | 14.0% | 19.9% |
| Median | 8.7% | 18.6% |
| Interquartile 25% (IQ1) | 6.1% | 16.2% |
| Interquartile 75% (IQ3) | 14.3% | 21.6% |
| Interquartile Range (IQR) | 8.2% | 5.4% |
| Standard Deviation (Sample) | 13.2% | 9.6% |
| Standard Deviation (Population) | 13.0% | 9.5% |
Similar Demographics by Child Poverty Among Boys Under 16
Demographics Similar to Immigrants from Japan by Child Poverty Among Boys Under 16
In terms of child poverty among boys under 16, the demographic groups most similar to Immigrants from Japan are Immigrants from Ireland (13.1%, a difference of 0.10%), Maltese (13.2%, a difference of 0.32%), Norwegian (13.2%, a difference of 0.41%), Immigrants from Korea (13.0%, a difference of 0.76%), and Bulgarian (13.3%, a difference of 0.94%).
| Demographics | Rating | Rank | Child Poverty Among Boys Under 16 |
| Immigrants | Singapore | 100.0 /100 | #8 | Exceptional 12.5% |
| Immigrants | Iran | 100.0 /100 | #9 | Exceptional 12.5% |
| Bhutanese | 100.0 /100 | #10 | Exceptional 12.6% |
| Immigrants | South Central Asia | 100.0 /100 | #11 | Exceptional 12.7% |
| Burmese | 99.9 /100 | #12 | Exceptional 13.0% |
| Immigrants | Korea | 99.9 /100 | #13 | Exceptional 13.0% |
| Immigrants | Ireland | 99.9 /100 | #14 | Exceptional 13.1% |
| Immigrants | Japan | 99.9 /100 | #15 | Exceptional 13.1% |
| Maltese | 99.9 /100 | #16 | Exceptional 13.2% |
| Norwegians | 99.9 /100 | #17 | Exceptional 13.2% |
| Bulgarians | 99.9 /100 | #18 | Exceptional 13.3% |
| Bolivians | 99.9 /100 | #19 | Exceptional 13.3% |
| Indians (Asian) | 99.9 /100 | #20 | Exceptional 13.3% |
| Immigrants | Eastern Asia | 99.9 /100 | #21 | Exceptional 13.3% |
| Tongans | 99.9 /100 | #22 | Exceptional 13.4% |
Demographics Similar to Nigerians by Child Poverty Among Boys Under 16
In terms of child poverty among boys under 16, the demographic groups most similar to Nigerians are Immigrants from Nigeria (18.4%, a difference of 0.25%), Marshallese (18.4%, a difference of 0.44%), American (18.6%, a difference of 0.50%), Sudanese (18.6%, a difference of 0.59%), and Nicaraguan (18.4%, a difference of 0.64%).
| Demographics | Rating | Rank | Child Poverty Among Boys Under 16 |
| Bermudans | 2.5 /100 | #227 | Tragic 18.1% |
| Immigrants | Nonimmigrants | 2.2 /100 | #228 | Tragic 18.2% |
| Immigrants | Micronesia | 1.8 /100 | #229 | Tragic 18.3% |
| Fijians | 1.8 /100 | #230 | Tragic 18.3% |
| Nicaraguans | 1.4 /100 | #231 | Tragic 18.4% |
| Marshallese | 1.3 /100 | #232 | Tragic 18.4% |
| Immigrants | Nigeria | 1.2 /100 | #233 | Tragic 18.4% |
| Nigerians | 1.1 /100 | #234 | Tragic 18.5% |
| Americans | 0.9 /100 | #235 | Tragic 18.6% |
| Sudanese | 0.9 /100 | #236 | Tragic 18.6% |
| Immigrants | Eritrea | 0.8 /100 | #237 | Tragic 18.6% |
| Immigrants | Laos | 0.8 /100 | #238 | Tragic 18.7% |
| Cape Verdeans | 0.7 /100 | #239 | Tragic 18.7% |
| Immigrants | Cuba | 0.6 /100 | #240 | Tragic 18.8% |
| Immigrants | Sudan | 0.6 /100 | #241 | Tragic 18.8% |