Immigrants from Austria vs Hopi Child Poverty Under the Age of 16
COMPARE
Immigrants from Austria
Hopi
Child Poverty Under the Age of 16
Child Poverty Under the Age of 16 Comparison
Immigrants from Austria
Hopi
14.2%
CHILD POVERTY UNDER THE AGE OF 16
98.5/ 100
METRIC RATING
60th/ 347
METRIC RANK
27.1%
CHILD POVERTY UNDER THE AGE OF 16
0.0/ 100
METRIC RATING
340th/ 347
METRIC RANK
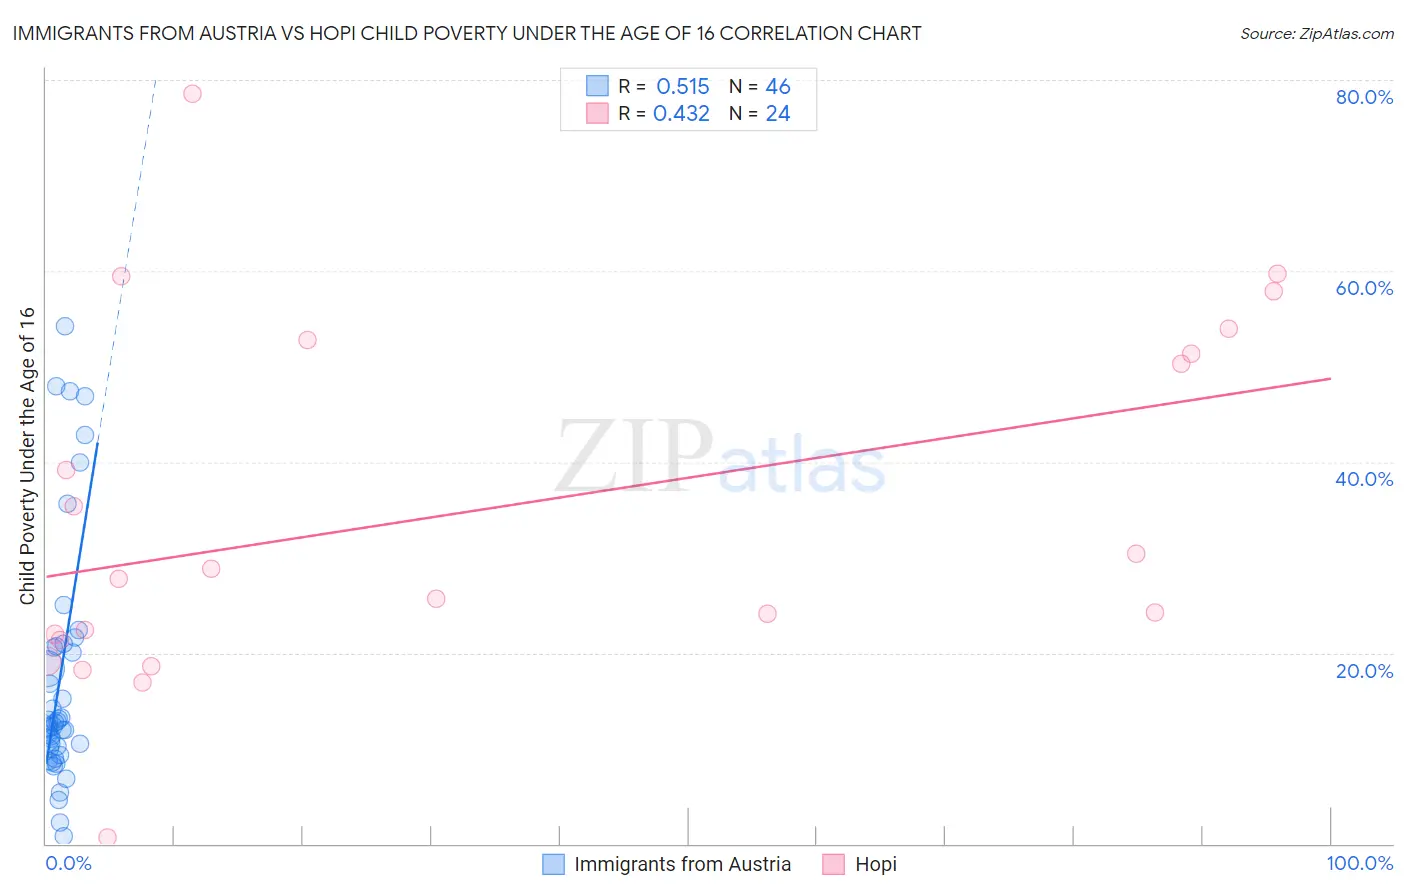
Immigrants from Austria vs Hopi Child Poverty Under the Age of 16 Correlation Chart
The statistical analysis conducted on geographies consisting of 166,865,257 people shows a substantial positive correlation between the proportion of Immigrants from Austria and poverty level among children under the age of 16 in the United States with a correlation coefficient (R) of 0.515 and weighted average of 14.2%. Similarly, the statistical analysis conducted on geographies consisting of 74,667,106 people shows a moderate positive correlation between the proportion of Hopi and poverty level among children under the age of 16 in the United States with a correlation coefficient (R) of 0.432 and weighted average of 27.1%, a difference of 91.5%.
Child Poverty Under the Age of 16 Correlation Summary
| Measurement | Immigrants from Austria | Hopi |
| Minimum | 0.78% | 0.70% |
| Maximum | 54.2% | 78.6% |
| Range | 53.4% | 77.9% |
| Mean | 17.4% | 34.9% |
| Median | 12.5% | 28.3% |
| Interquartile 25% (IQ1) | 9.9% | 21.6% |
| Interquartile 75% (IQ3) | 20.7% | 52.0% |
| Interquartile Range (IQR) | 10.8% | 30.4% |
| Standard Deviation (Sample) | 13.0% | 18.7% |
| Standard Deviation (Population) | 12.9% | 18.4% |
Similar Demographics by Child Poverty Under the Age of 16
Demographics Similar to Immigrants from Austria by Child Poverty Under the Age of 16
In terms of child poverty under the age of 16, the demographic groups most similar to Immigrants from Austria are Immigrants from Sweden (14.2%, a difference of 0.040%), Zimbabwean (14.2%, a difference of 0.050%), Scandinavian (14.1%, a difference of 0.19%), Immigrants from Pakistan (14.1%, a difference of 0.20%), and Immigrants from Belgium (14.1%, a difference of 0.22%).
| Demographics | Rating | Rank | Child Poverty Under the Age of 16 |
| Immigrants | Israel | 98.8 /100 | #53 | Exceptional 14.1% |
| Tsimshian | 98.8 /100 | #54 | Exceptional 14.1% |
| Immigrants | Indonesia | 98.7 /100 | #55 | Exceptional 14.1% |
| Immigrants | Serbia | 98.7 /100 | #56 | Exceptional 14.1% |
| Immigrants | Belgium | 98.6 /100 | #57 | Exceptional 14.1% |
| Immigrants | Pakistan | 98.6 /100 | #58 | Exceptional 14.1% |
| Scandinavians | 98.6 /100 | #59 | Exceptional 14.1% |
| Immigrants | Austria | 98.5 /100 | #60 | Exceptional 14.2% |
| Immigrants | Sweden | 98.5 /100 | #61 | Exceptional 14.2% |
| Zimbabweans | 98.5 /100 | #62 | Exceptional 14.2% |
| Immigrants | Europe | 98.4 /100 | #63 | Exceptional 14.2% |
| Immigrants | Romania | 98.3 /100 | #64 | Exceptional 14.2% |
| Immigrants | Philippines | 98.2 /100 | #65 | Exceptional 14.3% |
| Slovenes | 98.1 /100 | #66 | Exceptional 14.3% |
| Europeans | 98.1 /100 | #67 | Exceptional 14.3% |
Demographics Similar to Hopi by Child Poverty Under the Age of 16
In terms of child poverty under the age of 16, the demographic groups most similar to Hopi are Crow (26.0%, a difference of 4.4%), Yuman (28.9%, a difference of 6.8%), Cheyenne (25.4%, a difference of 6.8%), Pima (29.0%, a difference of 7.1%), and Immigrants from Yemen (29.1%, a difference of 7.3%).
| Demographics | Rating | Rank | Child Poverty Under the Age of 16 |
| Immigrants | Dominican Republic | 0.0 /100 | #333 | Tragic 24.0% |
| Blacks/African Americans | 0.0 /100 | #334 | Tragic 24.4% |
| Houma | 0.0 /100 | #335 | Tragic 24.9% |
| Yup'ik | 0.0 /100 | #336 | Tragic 25.1% |
| Sioux | 0.0 /100 | #337 | Tragic 25.2% |
| Cheyenne | 0.0 /100 | #338 | Tragic 25.4% |
| Crow | 0.0 /100 | #339 | Tragic 26.0% |
| Hopi | 0.0 /100 | #340 | Tragic 27.1% |
| Yuman | 0.0 /100 | #341 | Tragic 28.9% |
| Pima | 0.0 /100 | #342 | Tragic 29.0% |
| Immigrants | Yemen | 0.0 /100 | #343 | Tragic 29.1% |
| Navajo | 0.0 /100 | #344 | Tragic 30.2% |
| Lumbee | 0.0 /100 | #345 | Tragic 31.0% |
| Tohono O'odham | 0.0 /100 | #346 | Tragic 31.7% |
| Puerto Ricans | 0.0 /100 | #347 | Tragic 32.5% |