Immigrants from Asia vs Alaskan Athabascan Seniors Poverty Over the Age of 75
COMPARE
Immigrants from Asia
Alaskan Athabascan
Seniors Poverty Over the Age of 75
Seniors Poverty Over the Age of 75 Comparison
Immigrants from Asia
Alaskan Athabascans
12.2%
SENIORS POVERTY OVER THE AGE OF 75
47.8/ 100
METRIC RATING
177th/ 347
METRIC RANK
13.4%
SENIORS POVERTY OVER THE AGE OF 75
0.8/ 100
METRIC RATING
237th/ 347
METRIC RANK
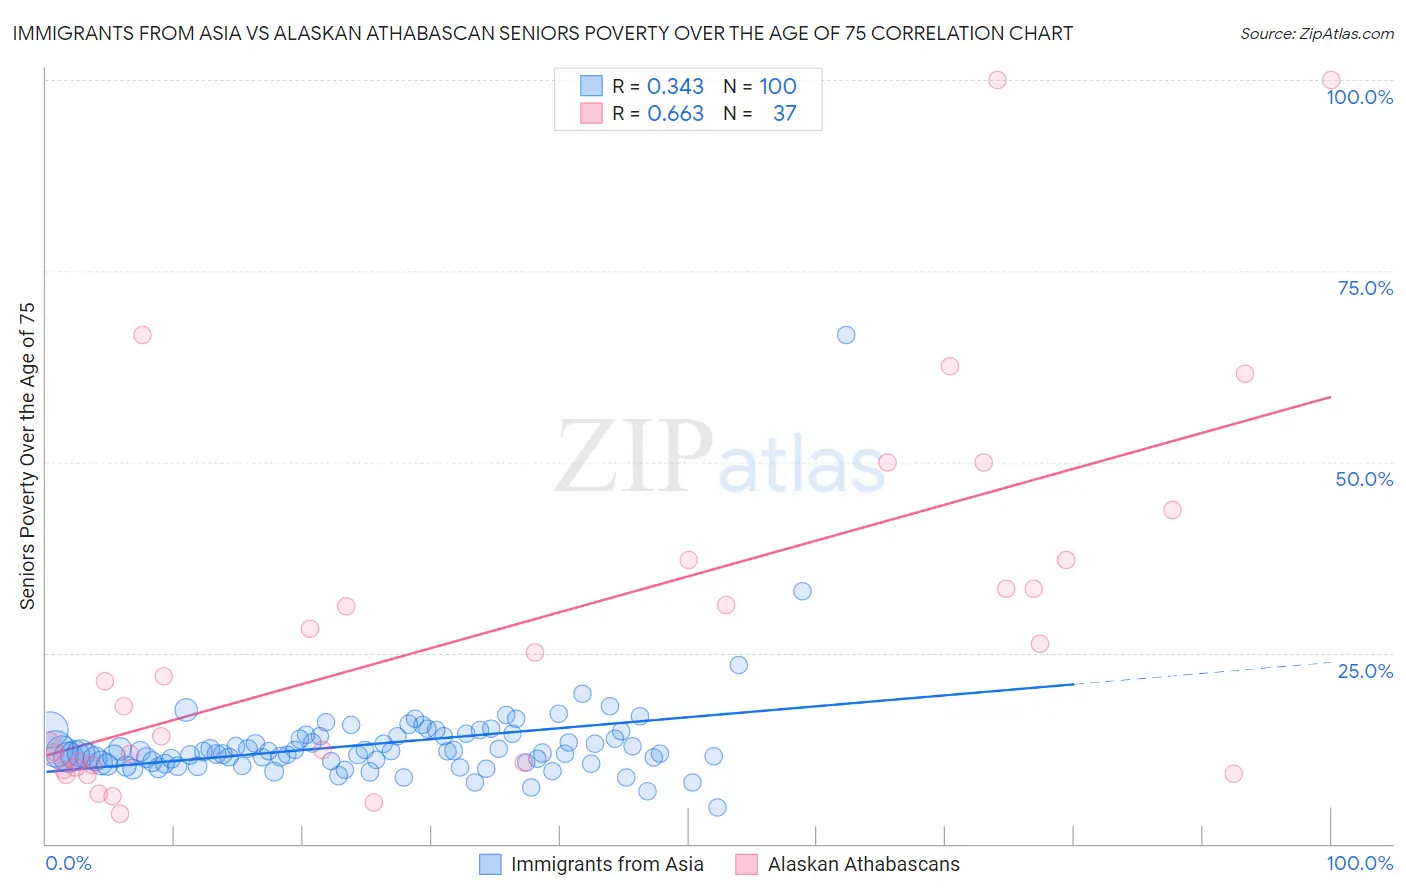
Immigrants from Asia vs Alaskan Athabascan Seniors Poverty Over the Age of 75 Correlation Chart
The statistical analysis conducted on geographies consisting of 535,988,916 people shows a mild positive correlation between the proportion of Immigrants from Asia and poverty level among seniors over the age of 75 in the United States with a correlation coefficient (R) of 0.343 and weighted average of 12.2%. Similarly, the statistical analysis conducted on geographies consisting of 45,512,640 people shows a significant positive correlation between the proportion of Alaskan Athabascans and poverty level among seniors over the age of 75 in the United States with a correlation coefficient (R) of 0.663 and weighted average of 13.4%, a difference of 9.5%.
Seniors Poverty Over the Age of 75 Correlation Summary
| Measurement | Immigrants from Asia | Alaskan Athabascan |
| Minimum | 4.8% | 3.9% |
| Maximum | 66.7% | 100.0% |
| Range | 61.9% | 96.1% |
| Mean | 13.1% | 28.1% |
| Median | 11.9% | 21.2% |
| Interquartile 25% (IQ1) | 10.7% | 10.2% |
| Interquartile 75% (IQ3) | 14.1% | 37.1% |
| Interquartile Range (IQR) | 3.4% | 27.0% |
| Standard Deviation (Sample) | 6.4% | 24.6% |
| Standard Deviation (Population) | 6.4% | 24.2% |
Similar Demographics by Seniors Poverty Over the Age of 75
Demographics Similar to Immigrants from Asia by Seniors Poverty Over the Age of 75
In terms of seniors poverty over the age of 75, the demographic groups most similar to Immigrants from Asia are Immigrants from Iran (12.2%, a difference of 0.020%), Nonimmigrants (12.2%, a difference of 0.080%), Immigrants from Saudi Arabia (12.2%, a difference of 0.13%), Immigrants from Europe (12.2%, a difference of 0.18%), and Mongolian (12.2%, a difference of 0.19%).
| Demographics | Rating | Rank | Seniors Poverty Over the Age of 75 |
| Immigrants | Thailand | 52.0 /100 | #170 | Average 12.2% |
| Spaniards | 51.6 /100 | #171 | Average 12.2% |
| Immigrants | Fiji | 51.5 /100 | #172 | Average 12.2% |
| Arabs | 50.5 /100 | #173 | Average 12.2% |
| Immigrants | Europe | 50.0 /100 | #174 | Average 12.2% |
| Immigrants | Saudi Arabia | 49.5 /100 | #175 | Average 12.2% |
| Immigrants | Iran | 48.1 /100 | #176 | Average 12.2% |
| Immigrants | Asia | 47.8 /100 | #177 | Average 12.2% |
| Immigrants | Nonimmigrants | 46.8 /100 | #178 | Average 12.2% |
| Mongolians | 45.5 /100 | #179 | Average 12.2% |
| Immigrants | South Eastern Asia | 44.3 /100 | #180 | Average 12.2% |
| Immigrants | Australia | 44.2 /100 | #181 | Average 12.2% |
| German Russians | 41.4 /100 | #182 | Average 12.3% |
| Laotians | 38.2 /100 | #183 | Fair 12.3% |
| Kiowa | 36.0 /100 | #184 | Fair 12.3% |
Demographics Similar to Alaskan Athabascans by Seniors Poverty Over the Age of 75
In terms of seniors poverty over the age of 75, the demographic groups most similar to Alaskan Athabascans are Peruvian (13.4%, a difference of 0.020%), Panamanian (13.4%, a difference of 0.12%), Moroccan (13.3%, a difference of 0.18%), Japanese (13.3%, a difference of 0.19%), and Argentinean (13.4%, a difference of 0.42%).
| Demographics | Rating | Rank | Seniors Poverty Over the Age of 75 |
| Immigrants | China | 1.5 /100 | #230 | Tragic 13.2% |
| Sub-Saharan Africans | 1.5 /100 | #231 | Tragic 13.2% |
| Immigrants | Chile | 1.3 /100 | #232 | Tragic 13.3% |
| Immigrants | Costa Rica | 1.3 /100 | #233 | Tragic 13.3% |
| Immigrants | Israel | 1.1 /100 | #234 | Tragic 13.3% |
| Japanese | 0.9 /100 | #235 | Tragic 13.3% |
| Moroccans | 0.9 /100 | #236 | Tragic 13.3% |
| Alaskan Athabascans | 0.8 /100 | #237 | Tragic 13.4% |
| Peruvians | 0.8 /100 | #238 | Tragic 13.4% |
| Panamanians | 0.8 /100 | #239 | Tragic 13.4% |
| Argentineans | 0.7 /100 | #240 | Tragic 13.4% |
| Immigrants | Russia | 0.6 /100 | #241 | Tragic 13.4% |
| Immigrants | Somalia | 0.6 /100 | #242 | Tragic 13.5% |
| Dutch West Indians | 0.6 /100 | #243 | Tragic 13.5% |
| Spanish Americans | 0.5 /100 | #244 | Tragic 13.5% |