Immigrants from Asia vs Alaskan Athabascan 6th Grade
COMPARE
Immigrants from Asia
Alaskan Athabascan
6th Grade
6th Grade Comparison
Immigrants from Asia
Alaskan Athabascans
96.6%
6TH GRADE
1.8/ 100
METRIC RATING
242nd/ 347
METRIC RANK
98.1%
6TH GRADE
100.0/ 100
METRIC RATING
12th/ 347
METRIC RANK
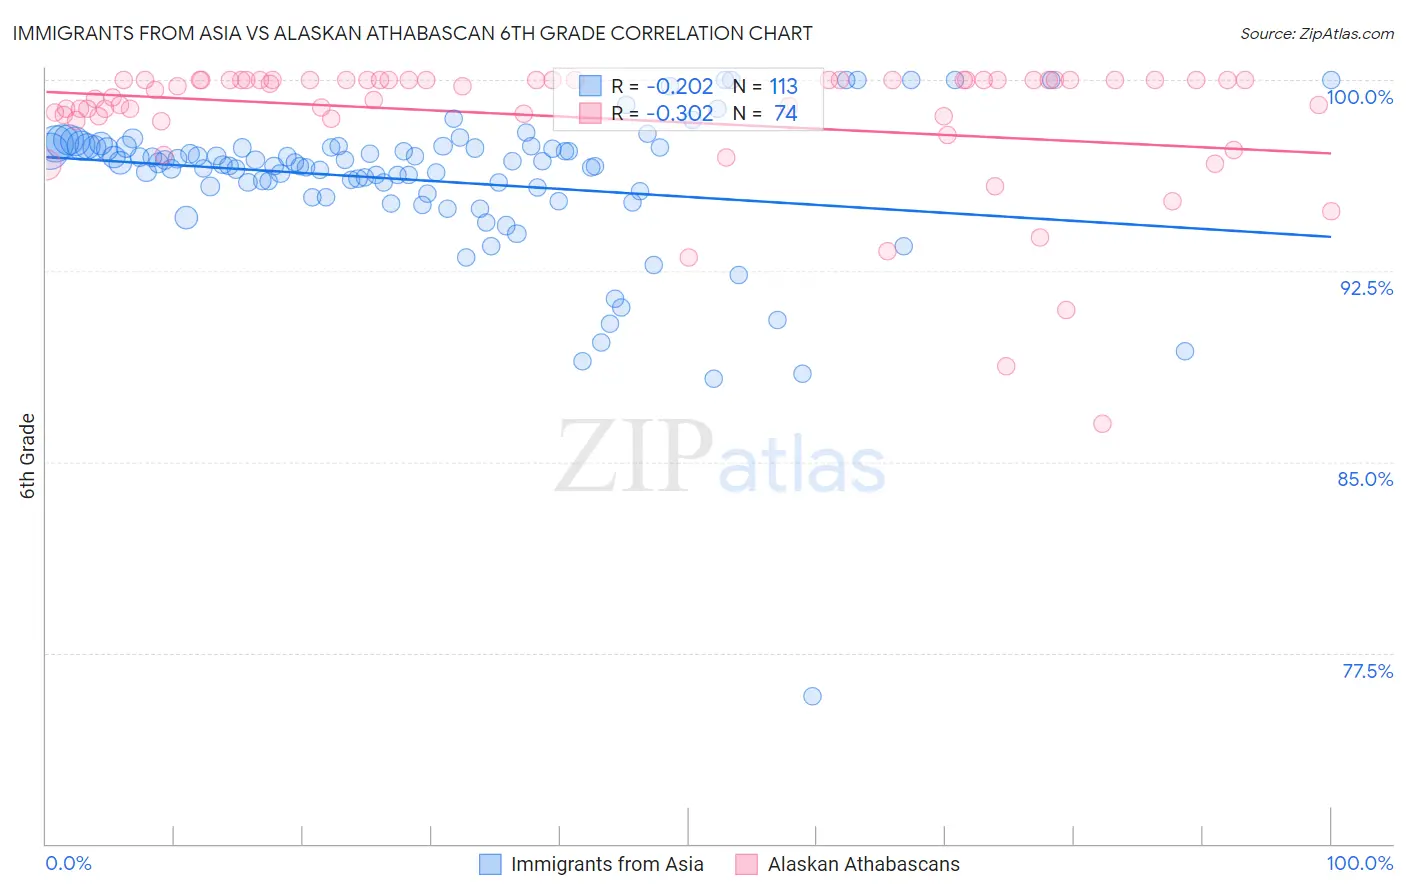
Immigrants from Asia vs Alaskan Athabascan 6th Grade Correlation Chart
The statistical analysis conducted on geographies consisting of 549,170,438 people shows a weak negative correlation between the proportion of Immigrants from Asia and percentage of population with at least 6th grade education in the United States with a correlation coefficient (R) of -0.202 and weighted average of 96.6%. Similarly, the statistical analysis conducted on geographies consisting of 45,820,365 people shows a mild negative correlation between the proportion of Alaskan Athabascans and percentage of population with at least 6th grade education in the United States with a correlation coefficient (R) of -0.302 and weighted average of 98.1%, a difference of 1.6%.
6th Grade Correlation Summary
| Measurement | Immigrants from Asia | Alaskan Athabascan |
| Minimum | 75.8% | 86.5% |
| Maximum | 100.0% | 100.0% |
| Range | 24.2% | 13.5% |
| Mean | 96.0% | 98.5% |
| Median | 96.8% | 99.8% |
| Interquartile 25% (IQ1) | 95.6% | 98.6% |
| Interquartile 75% (IQ3) | 97.4% | 100.0% |
| Interquartile Range (IQR) | 1.8% | 1.4% |
| Standard Deviation (Sample) | 3.1% | 2.6% |
| Standard Deviation (Population) | 3.1% | 2.6% |
Similar Demographics by 6th Grade
Demographics Similar to Immigrants from Asia by 6th Grade
In terms of 6th grade, the demographic groups most similar to Immigrants from Asia are Senegalese (96.6%, a difference of 0.0%), Nigerian (96.6%, a difference of 0.010%), Indian (Asian) (96.6%, a difference of 0.010%), Korean (96.6%, a difference of 0.010%), and Immigrants from Liberia (96.6%, a difference of 0.010%).
| Demographics | Rating | Rank | 6th Grade |
| Asians | 2.4 /100 | #235 | Tragic 96.6% |
| Immigrants | Indonesia | 2.3 /100 | #236 | Tragic 96.6% |
| Immigrants | Eastern Africa | 2.0 /100 | #237 | Tragic 96.6% |
| Nigerians | 1.9 /100 | #238 | Tragic 96.6% |
| Indians (Asian) | 1.9 /100 | #239 | Tragic 96.6% |
| Koreans | 1.9 /100 | #240 | Tragic 96.6% |
| Senegalese | 1.8 /100 | #241 | Tragic 96.6% |
| Immigrants | Asia | 1.8 /100 | #242 | Tragic 96.6% |
| Immigrants | Liberia | 1.6 /100 | #243 | Tragic 96.6% |
| Ethiopians | 1.5 /100 | #244 | Tragic 96.6% |
| Immigrants | Costa Rica | 1.3 /100 | #245 | Tragic 96.6% |
| Immigrants | Africa | 1.3 /100 | #246 | Tragic 96.6% |
| Bolivians | 1.0 /100 | #247 | Tragic 96.5% |
| Tohono O'odham | 1.0 /100 | #248 | Tragic 96.5% |
| Colombians | 0.9 /100 | #249 | Tragic 96.5% |
Demographics Similar to Alaskan Athabascans by 6th Grade
In terms of 6th grade, the demographic groups most similar to Alaskan Athabascans are English (98.1%, a difference of 0.010%), Tlingit-Haida (98.1%, a difference of 0.010%), Swedish (98.2%, a difference of 0.020%), Carpatho Rusyn (98.1%, a difference of 0.020%), and Inupiat (98.1%, a difference of 0.030%).
| Demographics | Rating | Rank | 6th Grade |
| Tsimshian | 100.0 /100 | #5 | Exceptional 98.3% |
| Norwegians | 100.0 /100 | #6 | Exceptional 98.3% |
| Germans | 100.0 /100 | #7 | Exceptional 98.2% |
| Slovaks | 100.0 /100 | #8 | Exceptional 98.2% |
| Slovenes | 100.0 /100 | #9 | Exceptional 98.2% |
| Swedes | 100.0 /100 | #10 | Exceptional 98.2% |
| English | 100.0 /100 | #11 | Exceptional 98.1% |
| Alaskan Athabascans | 100.0 /100 | #12 | Exceptional 98.1% |
| Tlingit-Haida | 100.0 /100 | #13 | Exceptional 98.1% |
| Carpatho Rusyns | 100.0 /100 | #14 | Exceptional 98.1% |
| Inupiat | 100.0 /100 | #15 | Exceptional 98.1% |
| Scottish | 100.0 /100 | #16 | Exceptional 98.1% |
| Poles | 100.0 /100 | #17 | Exceptional 98.1% |
| Pennsylvania Germans | 100.0 /100 | #18 | Exceptional 98.1% |
| Irish | 100.0 /100 | #19 | Exceptional 98.1% |