Immigrants from Armenia vs French American Indian Single Male Poverty
COMPARE
Immigrants from Armenia
French American Indian
Single Male Poverty
Single Male Poverty Comparison
Immigrants from Armenia
French American Indians
12.2%
SINGLE MALE POVERTY
96.7/ 100
METRIC RATING
103rd/ 347
METRIC RANK
15.0%
SINGLE MALE POVERTY
0.0/ 100
METRIC RATING
298th/ 347
METRIC RANK
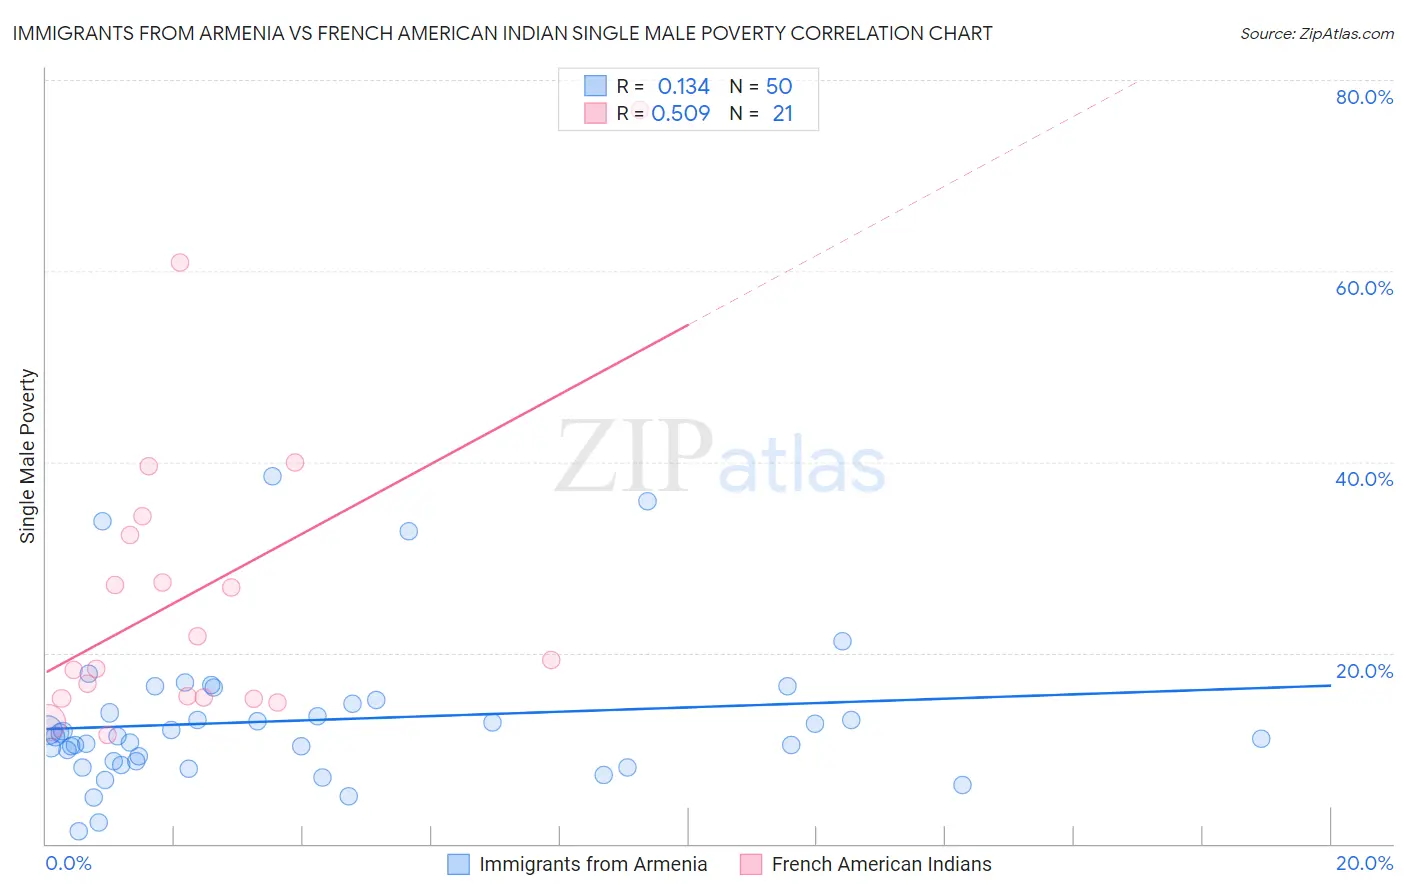
Immigrants from Armenia vs French American Indian Single Male Poverty Correlation Chart
The statistical analysis conducted on geographies consisting of 92,879,855 people shows a poor positive correlation between the proportion of Immigrants from Armenia and poverty level among single males in the United States with a correlation coefficient (R) of 0.134 and weighted average of 12.2%. Similarly, the statistical analysis conducted on geographies consisting of 125,004,458 people shows a substantial positive correlation between the proportion of French American Indians and poverty level among single males in the United States with a correlation coefficient (R) of 0.509 and weighted average of 15.0%, a difference of 22.4%.
Single Male Poverty Correlation Summary
| Measurement | Immigrants from Armenia | French American Indian |
| Minimum | 1.4% | 11.4% |
| Maximum | 38.5% | 76.9% |
| Range | 37.2% | 65.5% |
| Mean | 12.9% | 26.7% |
| Median | 11.3% | 19.2% |
| Interquartile 25% (IQ1) | 8.7% | 15.3% |
| Interquartile 75% (IQ3) | 14.7% | 33.3% |
| Interquartile Range (IQR) | 6.0% | 18.0% |
| Standard Deviation (Sample) | 7.7% | 16.6% |
| Standard Deviation (Population) | 7.7% | 16.2% |
Similar Demographics by Single Male Poverty
Demographics Similar to Immigrants from Armenia by Single Male Poverty
In terms of single male poverty, the demographic groups most similar to Immigrants from Armenia are Immigrants from Kazakhstan (12.2%, a difference of 0.010%), Immigrants from Europe (12.2%, a difference of 0.14%), Immigrants from Latvia (12.2%, a difference of 0.15%), Immigrants from Australia (12.2%, a difference of 0.18%), and Immigrants from Cuba (12.2%, a difference of 0.29%).
| Demographics | Rating | Rank | Single Male Poverty |
| Immigrants | Sweden | 97.5 /100 | #96 | Exceptional 12.2% |
| Immigrants | Italy | 97.4 /100 | #97 | Exceptional 12.2% |
| Guamanians/Chamorros | 97.4 /100 | #98 | Exceptional 12.2% |
| Immigrants | Cuba | 97.3 /100 | #99 | Exceptional 12.2% |
| Immigrants | Australia | 97.1 /100 | #100 | Exceptional 12.2% |
| Immigrants | Latvia | 97.0 /100 | #101 | Exceptional 12.2% |
| Immigrants | Europe | 97.0 /100 | #102 | Exceptional 12.2% |
| Immigrants | Armenia | 96.7 /100 | #103 | Exceptional 12.2% |
| Immigrants | Kazakhstan | 96.7 /100 | #104 | Exceptional 12.2% |
| Jordanians | 95.9 /100 | #105 | Exceptional 12.3% |
| Immigrants | Morocco | 95.6 /100 | #106 | Exceptional 12.3% |
| Iraqis | 95.1 /100 | #107 | Exceptional 12.3% |
| Immigrants | Eastern Africa | 95.0 /100 | #108 | Exceptional 12.3% |
| Ugandans | 94.5 /100 | #109 | Exceptional 12.3% |
| Immigrants | Portugal | 93.6 /100 | #110 | Exceptional 12.3% |
Demographics Similar to French American Indians by Single Male Poverty
In terms of single male poverty, the demographic groups most similar to French American Indians are Delaware (15.0%, a difference of 0.39%), Cree (15.1%, a difference of 0.84%), Immigrants from Dominican Republic (14.8%, a difference of 1.3%), African (14.7%, a difference of 1.6%), and Dominican (15.2%, a difference of 1.7%).
| Demographics | Rating | Rank | Single Male Poverty |
| Bahamians | 0.0 /100 | #291 | Tragic 14.6% |
| Immigrants | Nonimmigrants | 0.0 /100 | #292 | Tragic 14.6% |
| French Canadians | 0.0 /100 | #293 | Tragic 14.6% |
| Ottawa | 0.0 /100 | #294 | Tragic 14.6% |
| Scotch-Irish | 0.0 /100 | #295 | Tragic 14.7% |
| Africans | 0.0 /100 | #296 | Tragic 14.7% |
| Immigrants | Dominican Republic | 0.0 /100 | #297 | Tragic 14.8% |
| French American Indians | 0.0 /100 | #298 | Tragic 15.0% |
| Delaware | 0.0 /100 | #299 | Tragic 15.0% |
| Cree | 0.0 /100 | #300 | Tragic 15.1% |
| Dominicans | 0.0 /100 | #301 | Tragic 15.2% |
| Alsatians | 0.0 /100 | #302 | Tragic 15.2% |
| Aleuts | 0.0 /100 | #303 | Tragic 15.4% |
| Alaska Natives | 0.0 /100 | #304 | Tragic 15.4% |
| Blackfeet | 0.0 /100 | #305 | Tragic 15.5% |