Costa Rican vs French American Indian Single Male Poverty
COMPARE
Costa Rican
French American Indian
Single Male Poverty
Single Male Poverty Comparison
Costa Ricans
French American Indians
12.8%
SINGLE MALE POVERTY
50.0/ 100
METRIC RATING
174th/ 347
METRIC RANK
15.0%
SINGLE MALE POVERTY
0.0/ 100
METRIC RATING
298th/ 347
METRIC RANK
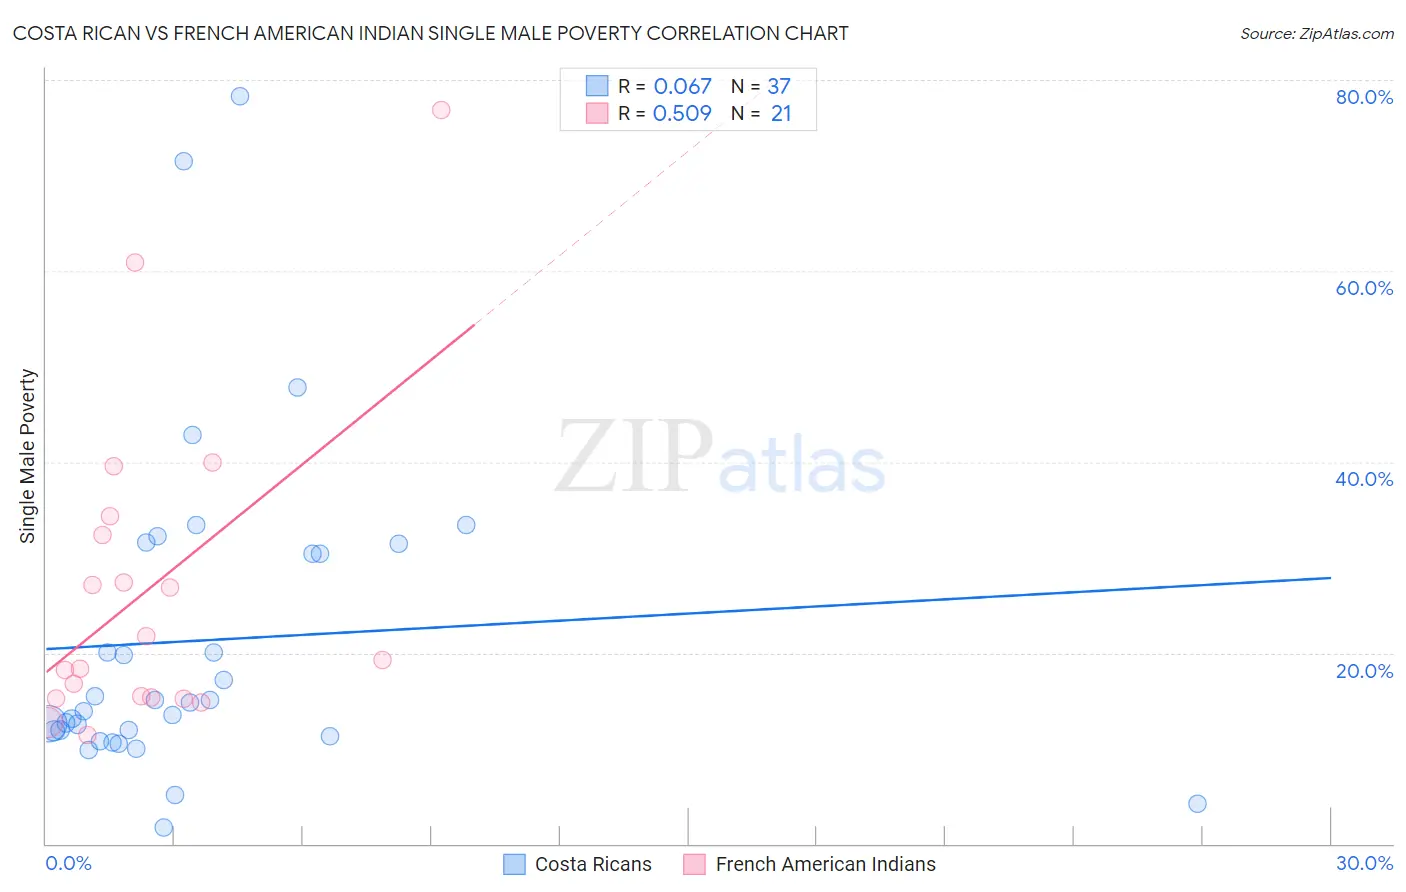
Costa Rican vs French American Indian Single Male Poverty Correlation Chart
The statistical analysis conducted on geographies consisting of 235,048,868 people shows a slight positive correlation between the proportion of Costa Ricans and poverty level among single males in the United States with a correlation coefficient (R) of 0.067 and weighted average of 12.8%. Similarly, the statistical analysis conducted on geographies consisting of 125,004,458 people shows a substantial positive correlation between the proportion of French American Indians and poverty level among single males in the United States with a correlation coefficient (R) of 0.509 and weighted average of 15.0%, a difference of 17.0%.
Single Male Poverty Correlation Summary
| Measurement | Costa Rican | French American Indian |
| Minimum | 1.6% | 11.4% |
| Maximum | 78.3% | 76.9% |
| Range | 76.6% | 65.5% |
| Mean | 21.3% | 26.7% |
| Median | 14.7% | 19.2% |
| Interquartile 25% (IQ1) | 11.5% | 15.3% |
| Interquartile 75% (IQ3) | 30.9% | 33.3% |
| Interquartile Range (IQR) | 19.4% | 18.0% |
| Standard Deviation (Sample) | 16.8% | 16.6% |
| Standard Deviation (Population) | 16.6% | 16.2% |
Similar Demographics by Single Male Poverty
Demographics Similar to Costa Ricans by Single Male Poverty
In terms of single male poverty, the demographic groups most similar to Costa Ricans are Immigrants from St. Vincent and the Grenadines (12.8%, a difference of 0.050%), Croatian (12.8%, a difference of 0.060%), South African (12.8%, a difference of 0.080%), Danish (12.8%, a difference of 0.080%), and Syrian (12.8%, a difference of 0.080%).
| Demographics | Rating | Rank | Single Male Poverty |
| Immigrants | Sudan | 58.2 /100 | #167 | Average 12.7% |
| Immigrants | Barbados | 57.7 /100 | #168 | Average 12.7% |
| Puget Sound Salish | 54.3 /100 | #169 | Average 12.8% |
| Guyanese | 52.0 /100 | #170 | Average 12.8% |
| South Africans | 51.5 /100 | #171 | Average 12.8% |
| Danes | 51.4 /100 | #172 | Average 12.8% |
| Immigrants | St. Vincent and the Grenadines | 50.9 /100 | #173 | Average 12.8% |
| Costa Ricans | 50.0 /100 | #174 | Average 12.8% |
| Croatians | 48.9 /100 | #175 | Average 12.8% |
| Syrians | 48.4 /100 | #176 | Average 12.8% |
| Immigrants | Canada | 44.8 /100 | #177 | Average 12.8% |
| Immigrants | Switzerland | 43.1 /100 | #178 | Average 12.8% |
| Israelis | 41.0 /100 | #179 | Average 12.9% |
| Immigrants | North America | 37.7 /100 | #180 | Fair 12.9% |
| Panamanians | 37.6 /100 | #181 | Fair 12.9% |
Demographics Similar to French American Indians by Single Male Poverty
In terms of single male poverty, the demographic groups most similar to French American Indians are Delaware (15.0%, a difference of 0.39%), Cree (15.1%, a difference of 0.84%), Immigrants from Dominican Republic (14.8%, a difference of 1.3%), African (14.7%, a difference of 1.6%), and Dominican (15.2%, a difference of 1.7%).
| Demographics | Rating | Rank | Single Male Poverty |
| Bahamians | 0.0 /100 | #291 | Tragic 14.6% |
| Immigrants | Nonimmigrants | 0.0 /100 | #292 | Tragic 14.6% |
| French Canadians | 0.0 /100 | #293 | Tragic 14.6% |
| Ottawa | 0.0 /100 | #294 | Tragic 14.6% |
| Scotch-Irish | 0.0 /100 | #295 | Tragic 14.7% |
| Africans | 0.0 /100 | #296 | Tragic 14.7% |
| Immigrants | Dominican Republic | 0.0 /100 | #297 | Tragic 14.8% |
| French American Indians | 0.0 /100 | #298 | Tragic 15.0% |
| Delaware | 0.0 /100 | #299 | Tragic 15.0% |
| Cree | 0.0 /100 | #300 | Tragic 15.1% |
| Dominicans | 0.0 /100 | #301 | Tragic 15.2% |
| Alsatians | 0.0 /100 | #302 | Tragic 15.2% |
| Aleuts | 0.0 /100 | #303 | Tragic 15.4% |
| Alaska Natives | 0.0 /100 | #304 | Tragic 15.4% |
| Blackfeet | 0.0 /100 | #305 | Tragic 15.5% |