Immigrants from Argentina vs Salvadoran Female Poverty Among 18-24 Year Olds
COMPARE
Immigrants from Argentina
Salvadoran
Female Poverty Among 18-24 Year Olds
Female Poverty Among 18-24 Year Olds Comparison
Immigrants from Argentina
Salvadorans
18.0%
FEMALE POVERTY AMONG 18-24 YEAR OLDS
100.0/ 100
METRIC RATING
41st/ 347
METRIC RANK
19.1%
FEMALE POVERTY AMONG 18-24 YEAR OLDS
98.4/ 100
METRIC RATING
97th/ 347
METRIC RANK
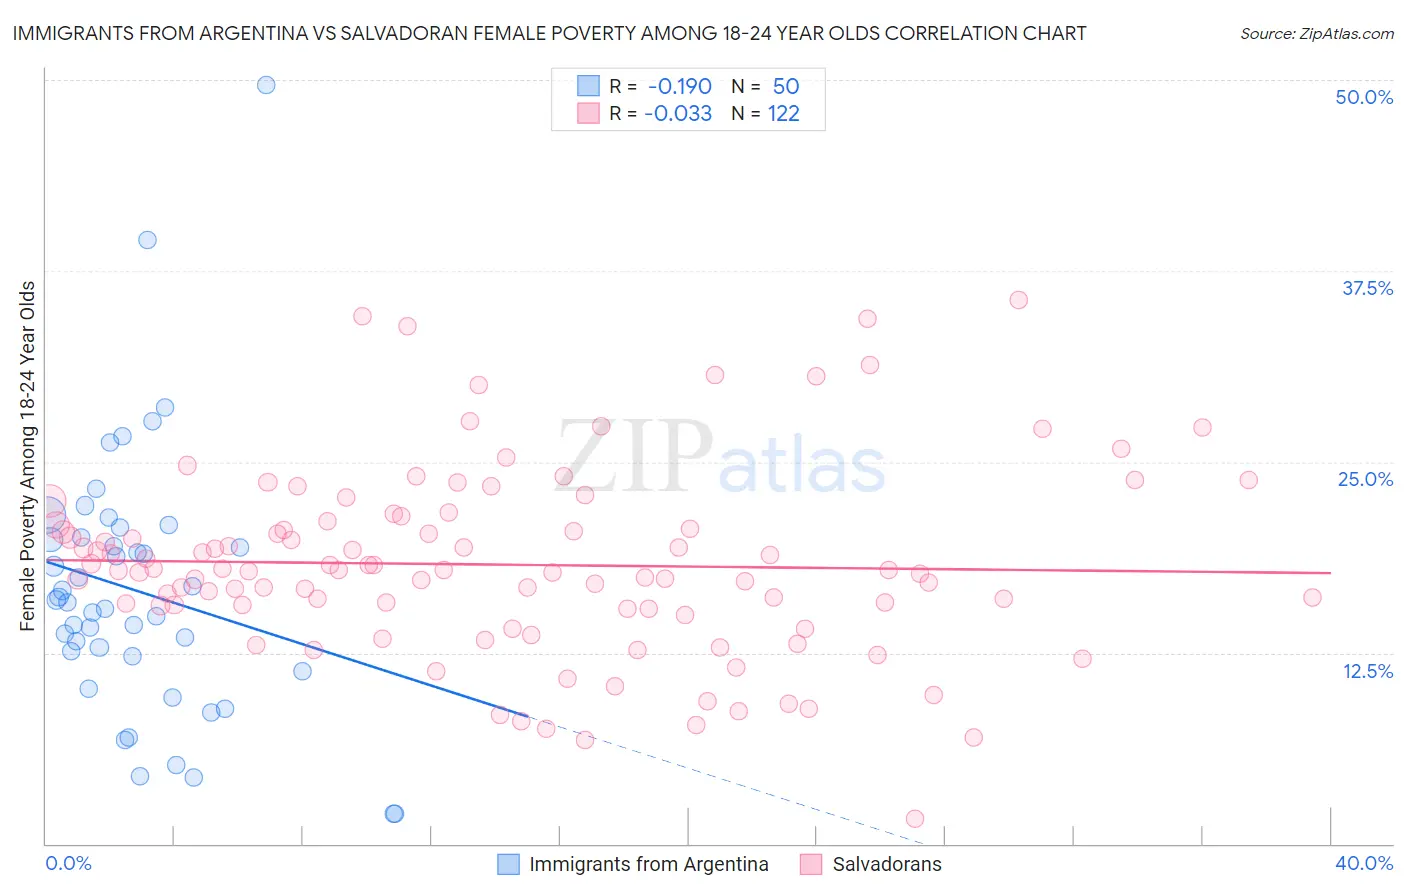
Immigrants from Argentina vs Salvadoran Female Poverty Among 18-24 Year Olds Correlation Chart
The statistical analysis conducted on geographies consisting of 260,510,179 people shows a poor negative correlation between the proportion of Immigrants from Argentina and poverty level among females between the ages 18 and 24 in the United States with a correlation coefficient (R) of -0.190 and weighted average of 18.0%. Similarly, the statistical analysis conducted on geographies consisting of 390,935,430 people shows no correlation between the proportion of Salvadorans and poverty level among females between the ages 18 and 24 in the United States with a correlation coefficient (R) of -0.033 and weighted average of 19.1%, a difference of 6.1%.
Female Poverty Among 18-24 Year Olds Correlation Summary
| Measurement | Immigrants from Argentina | Salvadoran |
| Minimum | 2.0% | 1.7% |
| Maximum | 49.6% | 35.6% |
| Range | 47.7% | 34.0% |
| Mean | 16.5% | 18.3% |
| Median | 15.9% | 17.9% |
| Interquartile 25% (IQ1) | 12.3% | 15.4% |
| Interquartile 75% (IQ3) | 20.0% | 20.9% |
| Interquartile Range (IQR) | 7.8% | 5.5% |
| Standard Deviation (Sample) | 8.7% | 6.2% |
| Standard Deviation (Population) | 8.6% | 6.1% |
Similar Demographics by Female Poverty Among 18-24 Year Olds
Demographics Similar to Immigrants from Argentina by Female Poverty Among 18-24 Year Olds
In terms of female poverty among 18-24 year olds, the demographic groups most similar to Immigrants from Argentina are Immigrants from Romania (18.0%, a difference of 0.010%), Puget Sound Salish (18.0%, a difference of 0.040%), South American (18.0%, a difference of 0.25%), Immigrants from Croatia (17.9%, a difference of 0.47%), and Bulgarian (18.1%, a difference of 0.47%).
| Demographics | Rating | Rank | Female Poverty Among 18-24 Year Olds |
| Immigrants | Nicaragua | 100.0 /100 | #34 | Exceptional 17.9% |
| Immigrants | Greece | 100.0 /100 | #35 | Exceptional 17.9% |
| Immigrants | South America | 100.0 /100 | #36 | Exceptional 17.9% |
| Immigrants | Croatia | 100.0 /100 | #37 | Exceptional 17.9% |
| South Americans | 100.0 /100 | #38 | Exceptional 18.0% |
| Puget Sound Salish | 100.0 /100 | #39 | Exceptional 18.0% |
| Immigrants | Romania | 100.0 /100 | #40 | Exceptional 18.0% |
| Immigrants | Argentina | 100.0 /100 | #41 | Exceptional 18.0% |
| Bulgarians | 100.0 /100 | #42 | Exceptional 18.1% |
| Macedonians | 100.0 /100 | #43 | Exceptional 18.1% |
| Nicaraguans | 100.0 /100 | #44 | Exceptional 18.1% |
| Spanish American Indians | 100.0 /100 | #45 | Exceptional 18.1% |
| Immigrants | Southern Europe | 100.0 /100 | #46 | Exceptional 18.2% |
| Asians | 100.0 /100 | #47 | Exceptional 18.2% |
| Sri Lankans | 100.0 /100 | #48 | Exceptional 18.2% |
Demographics Similar to Salvadorans by Female Poverty Among 18-24 Year Olds
In terms of female poverty among 18-24 year olds, the demographic groups most similar to Salvadorans are Immigrants from Jordan (19.1%, a difference of 0.010%), Immigrants from Czechoslovakia (19.1%, a difference of 0.080%), Chilean (19.1%, a difference of 0.10%), Ecuadorian (19.1%, a difference of 0.19%), and Immigrants from Caribbean (19.1%, a difference of 0.21%).
| Demographics | Rating | Rank | Female Poverty Among 18-24 Year Olds |
| Afghans | 99.0 /100 | #90 | Exceptional 19.0% |
| Romanians | 98.9 /100 | #91 | Exceptional 19.0% |
| Filipinos | 98.9 /100 | #92 | Exceptional 19.0% |
| Haitians | 98.9 /100 | #93 | Exceptional 19.0% |
| Ukrainians | 98.8 /100 | #94 | Exceptional 19.0% |
| Guamanians/Chamorros | 98.8 /100 | #95 | Exceptional 19.0% |
| Sierra Leoneans | 98.7 /100 | #96 | Exceptional 19.0% |
| Salvadorans | 98.4 /100 | #97 | Exceptional 19.1% |
| Immigrants | Jordan | 98.4 /100 | #98 | Exceptional 19.1% |
| Immigrants | Czechoslovakia | 98.3 /100 | #99 | Exceptional 19.1% |
| Chileans | 98.3 /100 | #100 | Exceptional 19.1% |
| Ecuadorians | 98.1 /100 | #101 | Exceptional 19.1% |
| Immigrants | Caribbean | 98.1 /100 | #102 | Exceptional 19.1% |
| Serbians | 98.0 /100 | #103 | Exceptional 19.1% |
| Immigrants | Afghanistan | 98.0 /100 | #104 | Exceptional 19.1% |