Immigrants from Argentina vs Salvadoran 7th Grade
COMPARE
Immigrants from Argentina
Salvadoran
7th Grade
7th Grade Comparison
Immigrants from Argentina
Salvadorans
95.9%
7TH GRADE
21.9/ 100
METRIC RATING
201st/ 347
METRIC RANK
91.5%
7TH GRADE
0.0/ 100
METRIC RATING
342nd/ 347
METRIC RANK
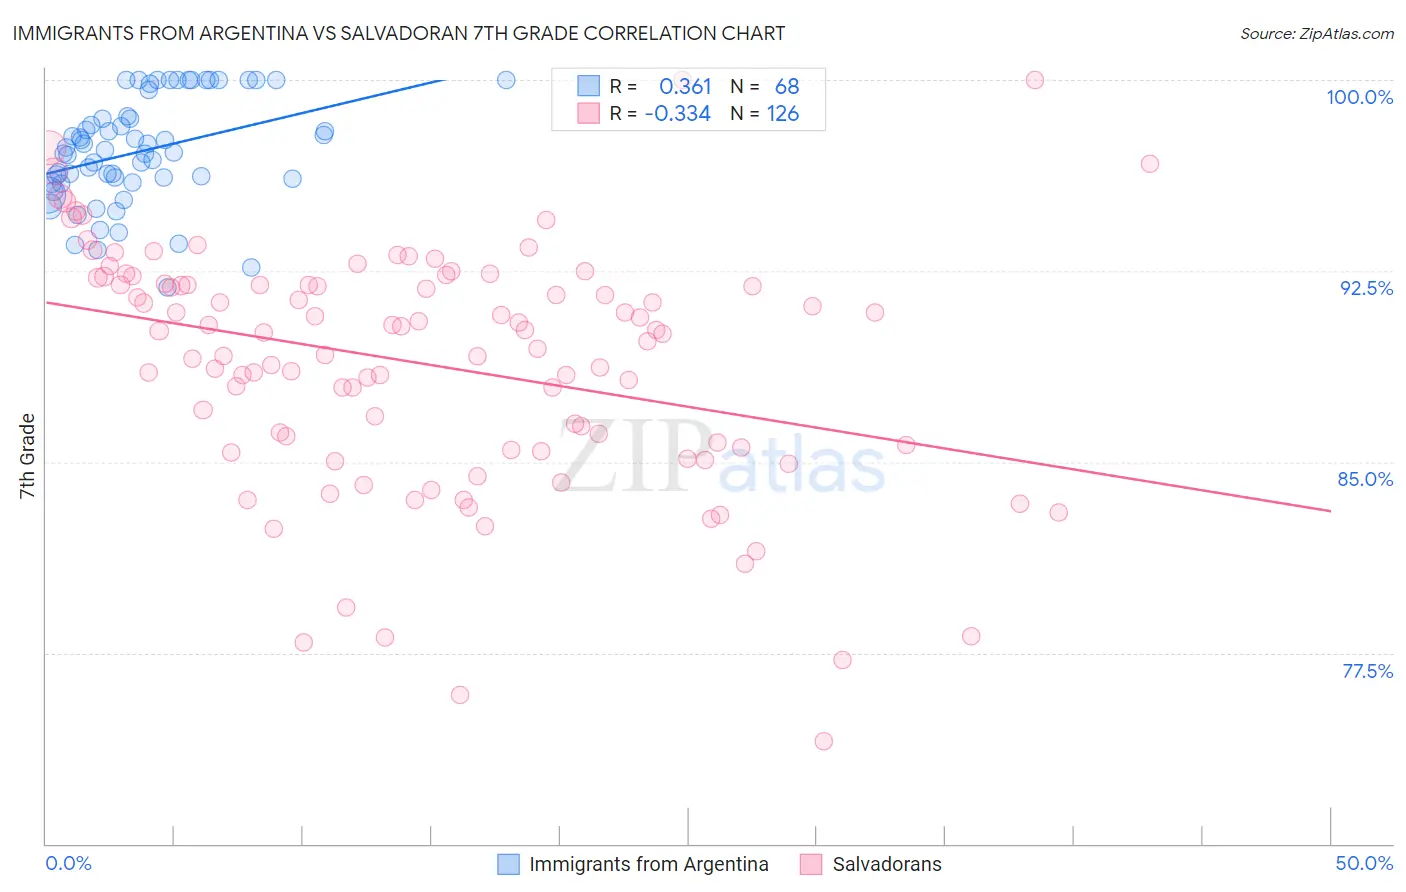
Immigrants from Argentina vs Salvadoran 7th Grade Correlation Chart
The statistical analysis conducted on geographies consisting of 264,434,317 people shows a mild positive correlation between the proportion of Immigrants from Argentina and percentage of population with at least 7th grade education in the United States with a correlation coefficient (R) of 0.361 and weighted average of 95.9%. Similarly, the statistical analysis conducted on geographies consisting of 399,020,248 people shows a mild negative correlation between the proportion of Salvadorans and percentage of population with at least 7th grade education in the United States with a correlation coefficient (R) of -0.334 and weighted average of 91.5%, a difference of 4.8%.
7th Grade Correlation Summary
| Measurement | Immigrants from Argentina | Salvadoran |
| Minimum | 91.8% | 74.0% |
| Maximum | 100.0% | 100.0% |
| Range | 8.2% | 26.0% |
| Mean | 97.2% | 88.8% |
| Median | 97.2% | 90.1% |
| Interquartile 25% (IQ1) | 96.0% | 85.6% |
| Interquartile 75% (IQ3) | 98.5% | 92.0% |
| Interquartile Range (IQR) | 2.5% | 6.4% |
| Standard Deviation (Sample) | 2.1% | 4.8% |
| Standard Deviation (Population) | 2.1% | 4.8% |
Similar Demographics by 7th Grade
Demographics Similar to Immigrants from Argentina by 7th Grade
In terms of 7th grade, the demographic groups most similar to Immigrants from Argentina are Immigrants from Northern Africa (95.8%, a difference of 0.0%), Guamanian/Chamorro (95.9%, a difference of 0.010%), Argentinean (95.9%, a difference of 0.010%), Comanche (95.8%, a difference of 0.010%), and Assyrian/Chaldean/Syriac (95.8%, a difference of 0.010%).
| Demographics | Rating | Rank | 7th Grade |
| Immigrants | Nepal | 30.0 /100 | #194 | Fair 95.9% |
| Sudanese | 28.1 /100 | #195 | Fair 95.9% |
| Apache | 27.6 /100 | #196 | Fair 95.9% |
| Immigrants | Zaire | 26.7 /100 | #197 | Fair 95.9% |
| Paraguayans | 24.8 /100 | #198 | Fair 95.9% |
| Guamanians/Chamorros | 23.5 /100 | #199 | Fair 95.9% |
| Argentineans | 23.2 /100 | #200 | Fair 95.9% |
| Immigrants | Argentina | 21.9 /100 | #201 | Fair 95.9% |
| Immigrants | Northern Africa | 21.4 /100 | #202 | Fair 95.8% |
| Comanche | 21.1 /100 | #203 | Fair 95.8% |
| Assyrians/Chaldeans/Syriacs | 20.5 /100 | #204 | Fair 95.8% |
| Moroccans | 18.9 /100 | #205 | Poor 95.8% |
| Africans | 17.6 /100 | #206 | Poor 95.8% |
| Navajo | 17.0 /100 | #207 | Poor 95.8% |
| Immigrants | Sudan | 17.0 /100 | #208 | Poor 95.8% |
Demographics Similar to Salvadorans by 7th Grade
In terms of 7th grade, the demographic groups most similar to Salvadorans are Immigrants from Guatemala (91.3%, a difference of 0.16%), Guatemalan (91.7%, a difference of 0.27%), Yakama (91.7%, a difference of 0.29%), Mexican (91.9%, a difference of 0.49%), and Immigrants from Central America (91.0%, a difference of 0.52%).
| Demographics | Rating | Rank | 7th Grade |
| Immigrants | Armenia | 0.0 /100 | #333 | Tragic 92.7% |
| Immigrants | Yemen | 0.0 /100 | #334 | Tragic 92.6% |
| Mexican American Indians | 0.0 /100 | #335 | Tragic 92.6% |
| Immigrants | Honduras | 0.0 /100 | #336 | Tragic 92.5% |
| Immigrants | Latin America | 0.0 /100 | #337 | Tragic 92.2% |
| Central Americans | 0.0 /100 | #338 | Tragic 92.1% |
| Mexicans | 0.0 /100 | #339 | Tragic 91.9% |
| Yakama | 0.0 /100 | #340 | Tragic 91.7% |
| Guatemalans | 0.0 /100 | #341 | Tragic 91.7% |
| Salvadorans | 0.0 /100 | #342 | Tragic 91.5% |
| Immigrants | Guatemala | 0.0 /100 | #343 | Tragic 91.3% |
| Immigrants | Central America | 0.0 /100 | #344 | Tragic 91.0% |
| Immigrants | El Salvador | 0.0 /100 | #345 | Tragic 90.9% |
| Immigrants | Mexico | 0.0 /100 | #346 | Tragic 90.7% |
| Spanish American Indians | 0.0 /100 | #347 | Tragic 90.3% |