Immigrants from Argentina vs Immigrants from Germany Female Poverty Among 18-24 Year Olds

COMPARE

Immigrants from Argentina
Race
Ancestry
AfghanAfricanAlaska NativeAlaskan AthabascanAlbanianAleutAlsatianAmericanApacheArabArapahoArgentineanArmenianAssyrian/Chaldean/SyriacAustralianAustrianBahamianBangladeshiBarbadianBasqueBelgianBelizeanBermudanBhutaneseBlackfeetBolivianBrazilianBritishBritish West IndianBulgarianBurmeseCajunCambodianCanadianCape VerdeanCarpatho RusynCelticCentral AmericanCentral American IndianCherokeeCheyenneChickasawChileanChineseChippewaChoctawColombianColvilleComancheCosta RicanCreeCreekCroatianCrowCubanCypriotCzechCzechoslovakianDanishDelawareDominicanDutchDutch West IndianEastern EuropeanEcuadorianEgyptianEnglishEstonianEthiopianEuropeanFijianFilipinoFinnishFrenchFrench American IndianFrench CanadianGermanGerman RussianGhanaianGreekGuamanian/ChamorroGuatemalanGuyaneseHaitianHmongHonduranHopiHoumaHungarianIcelanderIndian (Asian)IndonesianInupiatIranianIraqiIrishIroquoisIsraeliItalianJamaicanJapaneseJordanianKenyanKiowaKoreanLaotianLatvianLebaneseLiberianLithuanianLumbeeLuxembourgerMacedonianMalaysianMalteseMarshalleseMenomineeMexicanMexican American IndianMongolianMoroccanNative HawaiianNavajoNepaleseNew ZealanderNicaraguanNigerianNorthern EuropeanNorwegianOkinawanOsageOttawaPaiutePakistaniPalestinianPanamanianParaguayanPennsylvania GermanPeruvianPimaPolishPortuguesePotawatomiPuebloPuerto RicanPuget Sound SalishRomanianRussianSalvadoranSamoanScandinavianScotch-IrishScottishSeminoleSenegaleseSerbianShoshoneSierra LeoneanSiouxSlavicSlovakSloveneSomaliSouth AfricanSouth AmericanSouth American IndianSoviet UnionSpaniardSpanishSpanish AmericanSpanish American IndianSri LankanSubsaharan AfricanSudaneseSwedishSwissSyrianTaiwaneseThaiTlingit-HaidaTohono O'OdhamTonganTrinidadian and TobagonianTsimshianTurkishU.S. Virgin IslanderUgandanUkrainianUruguayanUteVenezuelanVietnameseWelshWest IndianYakamaYaquiYugoslavianYumanYup'ikZimbabwean
Immigration
NonimmigrantsImmigrantsAfghanistanAfricaAlbaniaArgentinaArmeniaAsiaAustraliaAustriaBahamasBangladeshBarbadosBelarusBelgiumBelizeBoliviaBosnia and HerzegovinaBrazilBulgariaBurma/MyanmarCabo VerdeCambodiaCameroonCanadaCaribbeanCentral AmericaChileChinaColombiaCongoCosta RicaCroatiaCubaCzechoslovakiaDenmarkDominicaDominican RepublicEastern AfricaEastern AsiaEastern EuropeEcuadorEgyptEl SalvadorEnglandEritreaEthiopiaEuropeFijiFranceGhanaGreeceGrenadaGuatemalaGuyanaHaitiHondurasHong KongHungaryIndiaIndonesiaIranIraqIrelandIsraelItalyJamaicaJapanJordanKazakhstanKenyaKoreaKuwaitLaosLatin AmericaLatviaLebanonLiberiaLithuaniaMalaysiaMexicoMicronesiaMiddle AfricaMoldovaMoroccoNepalNetherlandsNicaraguaNigeriaNorth AmericaNorth MacedoniaNorthern AfricaNorthern EuropeNorwayOceaniaPakistanPanamaPeruPhilippinesPolandPortugalRomaniaRussiaSaudi ArabiaScotlandSenegalSerbiaSierra LeoneSingaporeSomaliaSouth AfricaSouth AmericaSouth Central AsiaSouth Eastern AsiaSouthern EuropeSpainSri LankaSt. Vincent and the GrenadinesSudanSwedenSwitzerlandSyriaTaiwanThailandTrinidad and TobagoTurkeyUgandaUkraineUruguayUzbekistanVenezuelaVietnamWest IndiesWestern AfricaWestern AsiaWestern EuropeYemenZaireZimbabweAzores
Immigrants from Germany
Race
Ancestry
AfghanAfricanAlaska NativeAlaskan AthabascanAlbanianAleutAlsatianAmericanApacheArabArapahoArgentineanArmenianAssyrian/Chaldean/SyriacAustralianAustrianBahamianBangladeshiBarbadianBasqueBelgianBelizeanBermudanBhutaneseBlackfeetBolivianBrazilianBritishBritish West IndianBulgarianBurmeseCajunCambodianCanadianCape VerdeanCarpatho RusynCelticCentral AmericanCentral American IndianCherokeeCheyenneChickasawChileanChineseChippewaChoctawColombianColvilleComancheCosta RicanCreeCreekCroatianCrowCubanCypriotCzechCzechoslovakianDanishDelawareDominicanDutchDutch West IndianEastern EuropeanEcuadorianEgyptianEnglishEstonianEthiopianEuropeanFijianFilipinoFinnishFrenchFrench American IndianFrench CanadianGermanGerman RussianGhanaianGreekGuamanian/ChamorroGuatemalanGuyaneseHaitianHmongHonduranHopiHoumaHungarianIcelanderIndian (Asian)IndonesianInupiatIranianIraqiIrishIroquoisIsraeliItalianJamaicanJapaneseJordanianKenyanKiowaKoreanLaotianLatvianLebaneseLiberianLithuanianLumbeeLuxembourgerMacedonianMalaysianMalteseMarshalleseMenomineeMexicanMexican American IndianMongolianMoroccanNative HawaiianNavajoNepaleseNew ZealanderNicaraguanNigerianNorthern EuropeanNorwegianOkinawanOsageOttawaPaiutePakistaniPalestinianPanamanianParaguayanPennsylvania GermanPeruvianPimaPolishPortuguesePotawatomiPuebloPuerto RicanPuget Sound SalishRomanianRussianSalvadoranSamoanScandinavianScotch-IrishScottishSeminoleSenegaleseSerbianShoshoneSierra LeoneanSiouxSlavicSlovakSloveneSomaliSouth AfricanSouth AmericanSouth American IndianSoviet UnionSpaniardSpanishSpanish AmericanSpanish American IndianSri LankanSubsaharan AfricanSudaneseSwedishSwissSyrianTaiwaneseThaiTlingit-HaidaTohono O'OdhamTonganTrinidadian and TobagonianTsimshianTurkishU.S. Virgin IslanderUgandanUkrainianUruguayanUteVenezuelanVietnameseWelshWest IndianYakamaYaquiYugoslavianYumanYup'ikZimbabwean
Immigration
NonimmigrantsImmigrantsAfghanistanAfricaAlbaniaArmeniaAsiaAustraliaAustriaBahamasBangladeshBarbadosBelarusBelgiumBelizeBoliviaBosnia and HerzegovinaBrazilBulgariaBurma/MyanmarCabo VerdeCambodiaCameroonCanadaCaribbeanCentral AmericaChileChinaColombiaCongoCosta RicaCroatiaCubaCzechoslovakiaDenmarkDominicaDominican RepublicEastern AfricaEastern AsiaEastern EuropeEcuadorEgyptEl SalvadorEnglandEritreaEthiopiaEuropeFijiFranceGermanyGhanaGreeceGrenadaGuatemalaGuyanaHaitiHondurasHong KongHungaryIndiaIndonesiaIranIraqIrelandIsraelItalyJamaicaJapanJordanKazakhstanKenyaKoreaKuwaitLaosLatin AmericaLatviaLebanonLiberiaLithuaniaMalaysiaMexicoMicronesiaMiddle AfricaMoldovaMoroccoNepalNetherlandsNicaraguaNigeriaNorth AmericaNorth MacedoniaNorthern AfricaNorthern EuropeNorwayOceaniaPakistanPanamaPeruPhilippinesPolandPortugalRomaniaRussiaSaudi ArabiaScotlandSenegalSerbiaSierra LeoneSingaporeSomaliaSouth AfricaSouth AmericaSouth Central AsiaSouth Eastern AsiaSouthern EuropeSpainSri LankaSt. Vincent and the GrenadinesSudanSwedenSwitzerlandSyriaTaiwanThailandTrinidad and TobagoTurkeyUgandaUkraineUruguayUzbekistanVenezuelaVietnamWest IndiesWestern AfricaWestern AsiaWestern EuropeYemenZaireZimbabweAzores
Female Poverty Among 18-24 Year Olds
Income
Poverty
Unemployment
Labor Participation
Family Structure
Vehicle Availability
Education Level
Disability

Female Poverty Among 18-24 Year Olds Comparison

Immigrants from Argentina

Immigrants from Germany

Exceptional
Fair
18.0%
FEMALE POVERTY AMONG 18-24 YEAR OLDS
100.0/ 100
METRIC RATING
41st/ 347
METRIC RANK
20.3%
FEMALE POVERTY AMONG 18-24 YEAR OLDS
34.0/ 100
METRIC RATING
189th/ 347
METRIC RANK

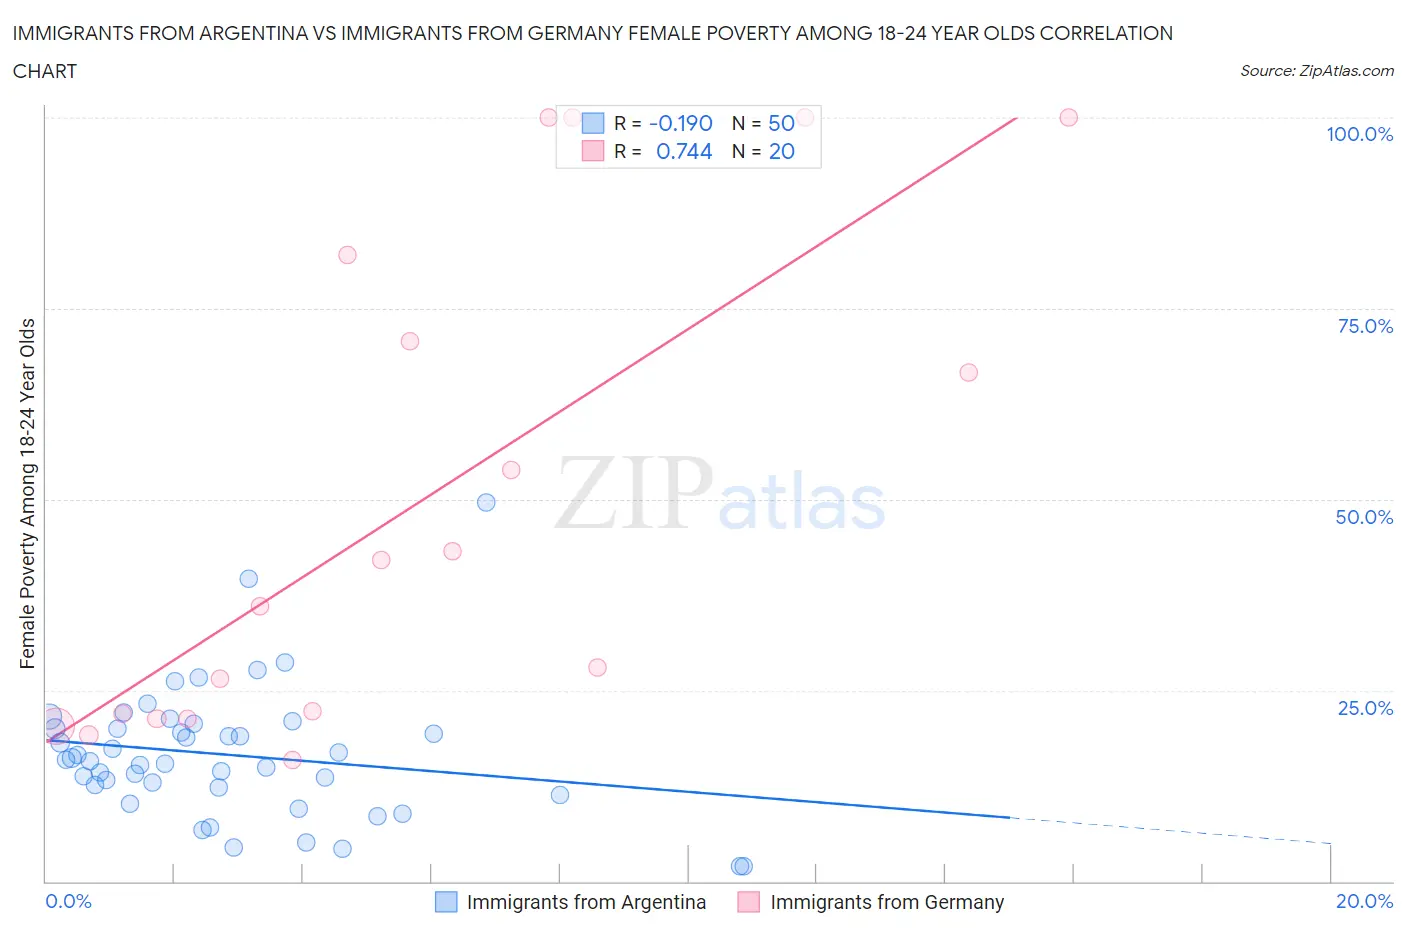
Immigrants from Argentina vs Immigrants from Germany Female Poverty Among 18-24 Year Olds Correlation Chart

The statistical analysis conducted on geographies consisting of 260,510,179 people shows a poor negative correlation between the proportion of Immigrants from Argentina and poverty level among females between the ages 18 and 24 in the United States with a correlation coefficient (R) of -0.190 and weighted average of 18.0%. Similarly, the statistical analysis conducted on geographies consisting of 447,977,087 people shows a strong positive correlation between the proportion of Immigrants from Germany and poverty level among females between the ages 18 and 24 in the United States with a correlation coefficient (R) of 0.744 and weighted average of 20.3%, a difference of 12.6%.
Immigrants from Argentina vs Immigrants from Germany Female Poverty Among 18-24 Year Olds

Female Poverty Among 18-24 Year Olds Correlation Summary

MeasurementImmigrants from ArgentinaImmigrants from Germany
Minimum2.0%15.9%
Maximum49.6%100.0%
Range47.7%84.1%
Mean16.5%49.5%
Median15.9%39.0%
Interquartile 25% (IQ1)12.3%21.6%
Interquartile 75% (IQ3)20.0%76.3%
Interquartile Range (IQR)7.8%54.7%
Standard Deviation (Sample)8.7%31.9%
Standard Deviation (Population)8.6%31.1%

Similar Demographics by Female Poverty Among 18-24 Year Olds

Demographics Similar to Immigrants from Argentina by Female Poverty Among 18-24 Year Olds

In terms of female poverty among 18-24 year olds, the demographic groups most similar to Immigrants from Argentina are Immigrants from Romania (18.0%, a difference of 0.010%), Puget Sound Salish (18.0%, a difference of 0.040%), South American (18.0%, a difference of 0.25%), Immigrants from Croatia (17.9%, a difference of 0.47%), and Bulgarian (18.1%, a difference of 0.47%).
DemographicsRating | RankFemale Poverty Among 18-24 Year Olds
Immigrants | Nicaragua
100.0
/100
|
#34
Exceptional
17.9%
Immigrants | Greece
100.0
/100
|
#35
Exceptional
17.9%
Immigrants | South America
100.0
/100
|
#36
Exceptional
17.9%
Immigrants | Croatia
100.0
/100
|
#37
Exceptional
17.9%
South Americans
100.0
/100
|
#38
Exceptional
18.0%
Puget Sound Salish
100.0
/100
|
#39
Exceptional
18.0%
Immigrants | Romania
100.0
/100
|
#40
Exceptional
18.0%
Immigrants | Argentina
100.0
/100
|
#41
Exceptional
18.0%
Bulgarians
100.0
/100
|
#42
Exceptional
18.1%
Macedonians
100.0
/100
|
#43
Exceptional
18.1%
Nicaraguans
100.0
/100
|
#44
Exceptional
18.1%
Spanish American Indians
100.0
/100
|
#45
Exceptional
18.1%
Immigrants | Southern Europe
100.0
/100
|
#46
Exceptional
18.2%
Asians
100.0
/100
|
#47
Exceptional
18.2%
Sri Lankans
100.0
/100
|
#48
Exceptional
18.2%

Demographics Similar to Immigrants from Germany by Female Poverty Among 18-24 Year Olds

In terms of female poverty among 18-24 year olds, the demographic groups most similar to Immigrants from Germany are Scandinavian (20.3%, a difference of 0.030%), Immigrants from Mexico (20.2%, a difference of 0.12%), Immigrants from Ethiopia (20.2%, a difference of 0.17%), Immigrants from Western Asia (20.3%, a difference of 0.27%), and Nepalese (20.2%, a difference of 0.30%).
DemographicsRating | RankFemale Poverty Among 18-24 Year Olds
Immigrants | Barbados
42.8
/100
|
#182
Average
20.2%
Lebanese
40.6
/100
|
#183
Average
20.2%
Immigrants | Central America
39.9
/100
|
#184
Fair
20.2%
Nepalese
39.7
/100
|
#185
Fair
20.2%
Immigrants | Ethiopia
37.3
/100
|
#186
Fair
20.2%
Immigrants | Mexico
36.3
/100
|
#187
Fair
20.2%
Scandinavians
34.6
/100
|
#188
Fair
20.3%
Immigrants | Germany
34.0
/100
|
#189
Fair
20.3%
Immigrants | Western Asia
29.3
/100
|
#190
Fair
20.3%
Moroccans
25.8
/100
|
#191
Fair
20.4%
Immigrants | Israel
24.4
/100
|
#192
Fair
20.4%
Nigerians
23.4
/100
|
#193
Fair
20.4%
Mexican American Indians
23.2
/100
|
#194
Fair
20.4%
Immigrants | Latvia
23.0
/100
|
#195
Fair
20.4%
Czechs
22.3
/100
|
#196
Fair
20.4%