Immigrants from Albania vs Danish Child Poverty Under the Age of 16
COMPARE
Immigrants from Albania
Danish
Child Poverty Under the Age of 16
Child Poverty Under the Age of 16 Comparison
Immigrants from Albania
Danes
15.8%
CHILD POVERTY UNDER THE AGE OF 16
70.7/ 100
METRIC RATING
160th/ 347
METRIC RANK
13.4%
CHILD POVERTY UNDER THE AGE OF 16
99.7/ 100
METRIC RATING
31st/ 347
METRIC RANK
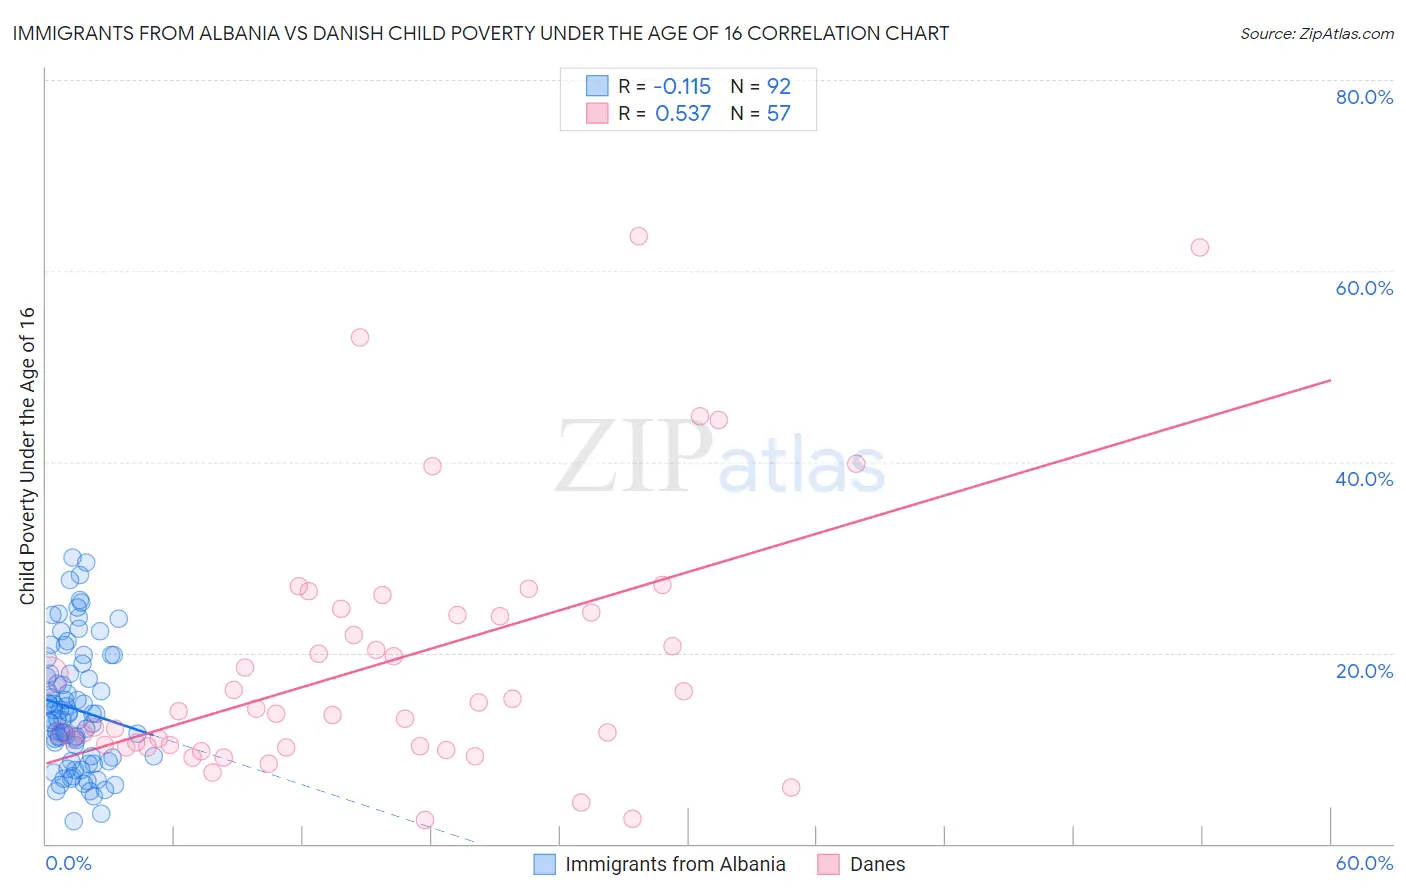
Immigrants from Albania vs Danish Child Poverty Under the Age of 16 Correlation Chart
The statistical analysis conducted on geographies consisting of 118,988,318 people shows a poor negative correlation between the proportion of Immigrants from Albania and poverty level among children under the age of 16 in the United States with a correlation coefficient (R) of -0.115 and weighted average of 15.8%. Similarly, the statistical analysis conducted on geographies consisting of 466,828,359 people shows a substantial positive correlation between the proportion of Danes and poverty level among children under the age of 16 in the United States with a correlation coefficient (R) of 0.537 and weighted average of 13.4%, a difference of 17.7%.
Child Poverty Under the Age of 16 Correlation Summary
| Measurement | Immigrants from Albania | Danish |
| Minimum | 2.3% | 2.5% |
| Maximum | 30.0% | 63.6% |
| Range | 27.7% | 61.2% |
| Mean | 14.1% | 18.9% |
| Median | 13.0% | 13.9% |
| Interquartile 25% (IQ1) | 9.1% | 10.2% |
| Interquartile 75% (IQ3) | 17.8% | 24.1% |
| Interquartile Range (IQR) | 8.8% | 13.9% |
| Standard Deviation (Sample) | 6.4% | 13.6% |
| Standard Deviation (Population) | 6.3% | 13.5% |
Similar Demographics by Child Poverty Under the Age of 16
Demographics Similar to Immigrants from Albania by Child Poverty Under the Age of 16
In terms of child poverty under the age of 16, the demographic groups most similar to Immigrants from Albania are Immigrants from Fiji (15.8%, a difference of 0.070%), Immigrants from Chile (15.7%, a difference of 0.32%), Immigrants from Nepal (15.7%, a difference of 0.34%), Immigrants from Northern Africa (15.8%, a difference of 0.38%), and Colombian (15.8%, a difference of 0.44%).
| Demographics | Rating | Rank | Child Poverty Under the Age of 16 |
| Venezuelans | 77.4 /100 | #153 | Good 15.6% |
| Samoans | 77.3 /100 | #154 | Good 15.6% |
| Syrians | 76.1 /100 | #155 | Good 15.6% |
| Immigrants | Venezuela | 74.9 /100 | #156 | Good 15.7% |
| Immigrants | Nepal | 72.9 /100 | #157 | Good 15.7% |
| Immigrants | Chile | 72.8 /100 | #158 | Good 15.7% |
| Immigrants | Fiji | 71.1 /100 | #159 | Good 15.8% |
| Immigrants | Albania | 70.7 /100 | #160 | Good 15.8% |
| Immigrants | Northern Africa | 68.1 /100 | #161 | Good 15.8% |
| Colombians | 67.6 /100 | #162 | Good 15.8% |
| Yugoslavians | 67.6 /100 | #163 | Good 15.8% |
| Immigrants | Germany | 67.3 /100 | #164 | Good 15.8% |
| Guamanians/Chamorros | 66.4 /100 | #165 | Good 15.9% |
| Immigrants | Oceania | 65.4 /100 | #166 | Good 15.9% |
| Costa Ricans | 61.1 /100 | #167 | Good 16.0% |
Demographics Similar to Danes by Child Poverty Under the Age of 16
In terms of child poverty under the age of 16, the demographic groups most similar to Danes are Tongan (13.4%, a difference of 0.010%), Turkish (13.4%, a difference of 0.21%), Asian (13.5%, a difference of 0.50%), Swedish (13.3%, a difference of 0.51%), and Assyrian/Chaldean/Syriac (13.3%, a difference of 0.68%).
| Demographics | Rating | Rank | Child Poverty Under the Age of 16 |
| Latvians | 99.8 /100 | #24 | Exceptional 13.2% |
| Eastern Europeans | 99.8 /100 | #25 | Exceptional 13.2% |
| Bolivians | 99.8 /100 | #26 | Exceptional 13.2% |
| Immigrants | China | 99.8 /100 | #27 | Exceptional 13.3% |
| Assyrians/Chaldeans/Syriacs | 99.7 /100 | #28 | Exceptional 13.3% |
| Swedes | 99.7 /100 | #29 | Exceptional 13.3% |
| Turks | 99.7 /100 | #30 | Exceptional 13.4% |
| Danes | 99.7 /100 | #31 | Exceptional 13.4% |
| Tongans | 99.7 /100 | #32 | Exceptional 13.4% |
| Asians | 99.6 /100 | #33 | Exceptional 13.5% |
| Russians | 99.6 /100 | #34 | Exceptional 13.5% |
| Lithuanians | 99.6 /100 | #35 | Exceptional 13.5% |
| Immigrants | Northern Europe | 99.6 /100 | #36 | Exceptional 13.6% |
| Immigrants | Bolivia | 99.6 /100 | #37 | Exceptional 13.6% |
| Luxembourgers | 99.5 /100 | #38 | Exceptional 13.6% |