Cambodian vs Danish Child Poverty Under the Age of 16
COMPARE
Cambodian
Danish
Child Poverty Under the Age of 16
Child Poverty Under the Age of 16 Comparison
Cambodians
Danes
14.4%
CHILD POVERTY UNDER THE AGE OF 16
97.8/ 100
METRIC RATING
72nd/ 347
METRIC RANK
13.4%
CHILD POVERTY UNDER THE AGE OF 16
99.7/ 100
METRIC RATING
31st/ 347
METRIC RANK
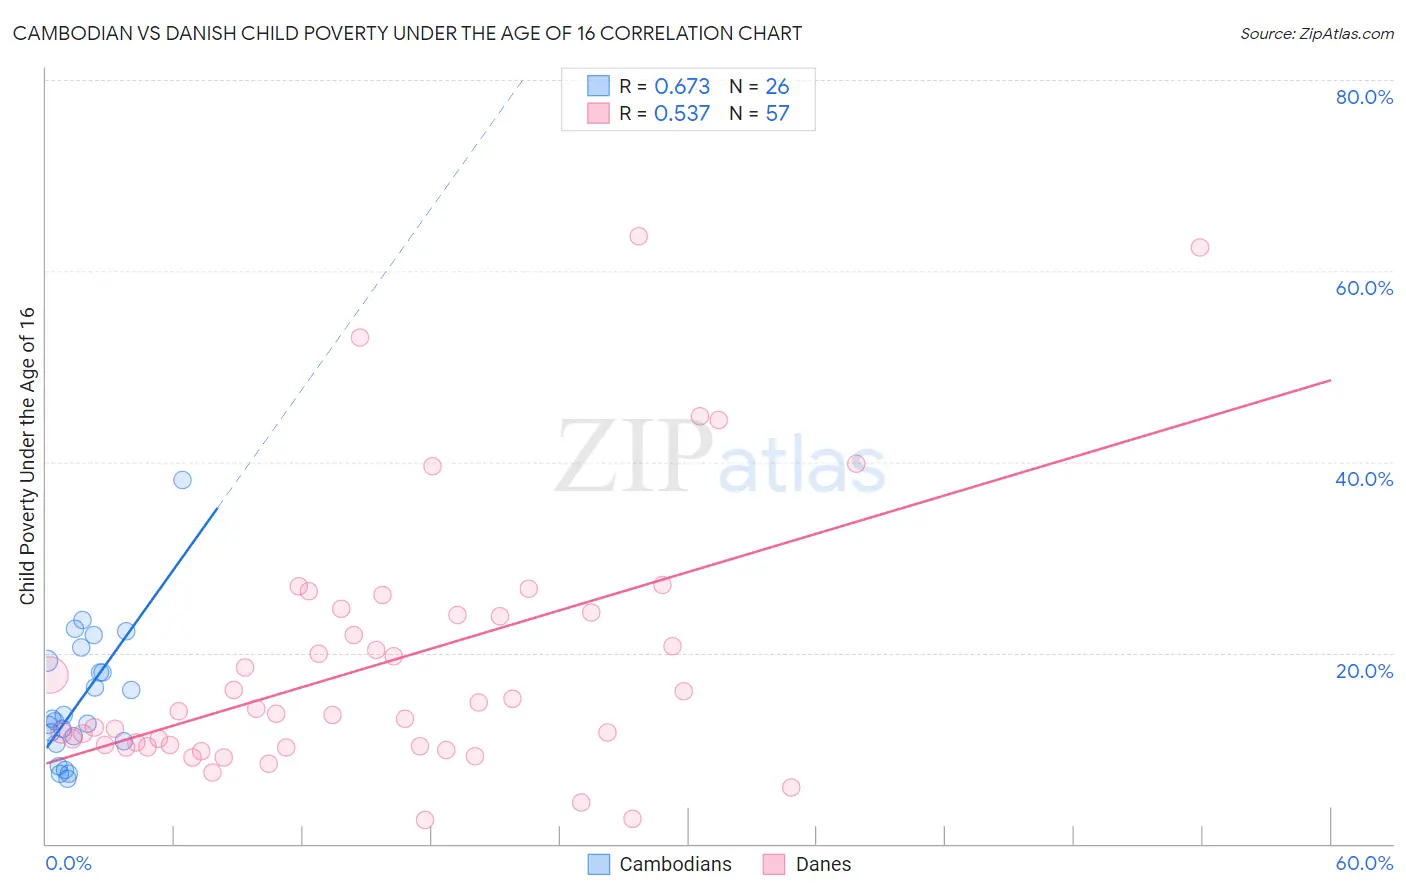
Cambodian vs Danish Child Poverty Under the Age of 16 Correlation Chart
The statistical analysis conducted on geographies consisting of 102,284,203 people shows a significant positive correlation between the proportion of Cambodians and poverty level among children under the age of 16 in the United States with a correlation coefficient (R) of 0.673 and weighted average of 14.4%. Similarly, the statistical analysis conducted on geographies consisting of 466,828,359 people shows a substantial positive correlation between the proportion of Danes and poverty level among children under the age of 16 in the United States with a correlation coefficient (R) of 0.537 and weighted average of 13.4%, a difference of 7.2%.
Child Poverty Under the Age of 16 Correlation Summary
| Measurement | Cambodian | Danish |
| Minimum | 6.8% | 2.5% |
| Maximum | 38.1% | 63.6% |
| Range | 31.2% | 61.2% |
| Mean | 15.2% | 18.9% |
| Median | 13.0% | 13.9% |
| Interquartile 25% (IQ1) | 10.7% | 10.2% |
| Interquartile 75% (IQ3) | 19.2% | 24.1% |
| Interquartile Range (IQR) | 8.4% | 13.9% |
| Standard Deviation (Sample) | 7.0% | 13.6% |
| Standard Deviation (Population) | 6.8% | 13.5% |
Similar Demographics by Child Poverty Under the Age of 16
Demographics Similar to Cambodians by Child Poverty Under the Age of 16
In terms of child poverty under the age of 16, the demographic groups most similar to Cambodians are Immigrants from Turkey (14.4%, a difference of 0.21%), Macedonian (14.4%, a difference of 0.21%), Immigrants from Poland (14.3%, a difference of 0.22%), Immigrants from Netherlands (14.3%, a difference of 0.23%), and Immigrants from Bulgaria (14.3%, a difference of 0.33%).
| Demographics | Rating | Rank | Child Poverty Under the Age of 16 |
| Immigrants | Philippines | 98.2 /100 | #65 | Exceptional 14.3% |
| Slovenes | 98.1 /100 | #66 | Exceptional 14.3% |
| Europeans | 98.1 /100 | #67 | Exceptional 14.3% |
| Laotians | 98.0 /100 | #68 | Exceptional 14.3% |
| Immigrants | Bulgaria | 98.0 /100 | #69 | Exceptional 14.3% |
| Immigrants | Netherlands | 97.9 /100 | #70 | Exceptional 14.3% |
| Immigrants | Poland | 97.9 /100 | #71 | Exceptional 14.3% |
| Cambodians | 97.8 /100 | #72 | Exceptional 14.4% |
| Immigrants | Turkey | 97.6 /100 | #73 | Exceptional 14.4% |
| Macedonians | 97.6 /100 | #74 | Exceptional 14.4% |
| Ukrainians | 97.5 /100 | #75 | Exceptional 14.4% |
| Immigrants | Eastern Europe | 97.5 /100 | #76 | Exceptional 14.4% |
| Australians | 97.5 /100 | #77 | Exceptional 14.4% |
| Immigrants | Russia | 97.3 /100 | #78 | Exceptional 14.5% |
| Swiss | 97.3 /100 | #79 | Exceptional 14.5% |
Demographics Similar to Danes by Child Poverty Under the Age of 16
In terms of child poverty under the age of 16, the demographic groups most similar to Danes are Tongan (13.4%, a difference of 0.010%), Turkish (13.4%, a difference of 0.21%), Asian (13.5%, a difference of 0.50%), Swedish (13.3%, a difference of 0.51%), and Assyrian/Chaldean/Syriac (13.3%, a difference of 0.68%).
| Demographics | Rating | Rank | Child Poverty Under the Age of 16 |
| Latvians | 99.8 /100 | #24 | Exceptional 13.2% |
| Eastern Europeans | 99.8 /100 | #25 | Exceptional 13.2% |
| Bolivians | 99.8 /100 | #26 | Exceptional 13.2% |
| Immigrants | China | 99.8 /100 | #27 | Exceptional 13.3% |
| Assyrians/Chaldeans/Syriacs | 99.7 /100 | #28 | Exceptional 13.3% |
| Swedes | 99.7 /100 | #29 | Exceptional 13.3% |
| Turks | 99.7 /100 | #30 | Exceptional 13.4% |
| Danes | 99.7 /100 | #31 | Exceptional 13.4% |
| Tongans | 99.7 /100 | #32 | Exceptional 13.4% |
| Asians | 99.6 /100 | #33 | Exceptional 13.5% |
| Russians | 99.6 /100 | #34 | Exceptional 13.5% |
| Lithuanians | 99.6 /100 | #35 | Exceptional 13.5% |
| Immigrants | Northern Europe | 99.6 /100 | #36 | Exceptional 13.6% |
| Immigrants | Bolivia | 99.6 /100 | #37 | Exceptional 13.6% |
| Luxembourgers | 99.5 /100 | #38 | Exceptional 13.6% |