Immigrants from Africa vs Uruguayan Child Poverty Under the Age of 16
COMPARE
Immigrants from Africa
Uruguayan
Child Poverty Under the Age of 16
Child Poverty Under the Age of 16 Comparison
Immigrants from Africa
Uruguayans
18.0%
CHILD POVERTY UNDER THE AGE OF 16
2.5/ 100
METRIC RATING
227th/ 347
METRIC RANK
16.1%
CHILD POVERTY UNDER THE AGE OF 16
54.7/ 100
METRIC RATING
169th/ 347
METRIC RANK
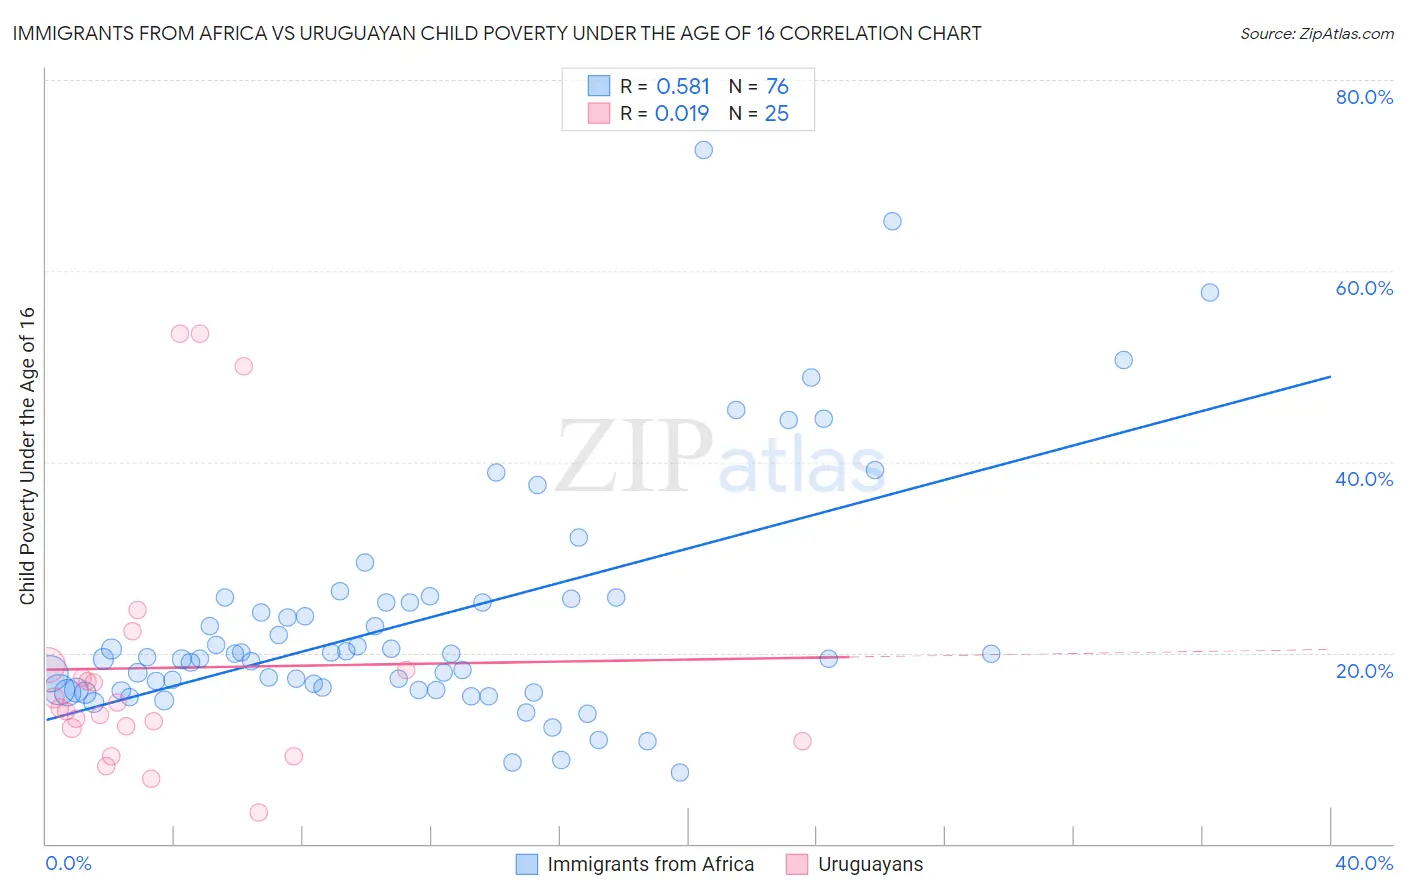
Immigrants from Africa vs Uruguayan Child Poverty Under the Age of 16 Correlation Chart
The statistical analysis conducted on geographies consisting of 464,107,258 people shows a substantial positive correlation between the proportion of Immigrants from Africa and poverty level among children under the age of 16 in the United States with a correlation coefficient (R) of 0.581 and weighted average of 18.0%. Similarly, the statistical analysis conducted on geographies consisting of 144,396,450 people shows no correlation between the proportion of Uruguayans and poverty level among children under the age of 16 in the United States with a correlation coefficient (R) of 0.019 and weighted average of 16.1%, a difference of 11.7%.
Child Poverty Under the Age of 16 Correlation Summary
| Measurement | Immigrants from Africa | Uruguayan |
| Minimum | 7.4% | 3.3% |
| Maximum | 72.6% | 53.4% |
| Range | 65.2% | 50.1% |
| Mean | 23.3% | 18.4% |
| Median | 19.5% | 14.2% |
| Interquartile 25% (IQ1) | 16.1% | 11.4% |
| Interquartile 75% (IQ3) | 25.3% | 18.4% |
| Interquartile Range (IQR) | 9.1% | 7.0% |
| Standard Deviation (Sample) | 12.5% | 13.6% |
| Standard Deviation (Population) | 12.4% | 13.3% |
Similar Demographics by Child Poverty Under the Age of 16
Demographics Similar to Immigrants from Africa by Child Poverty Under the Age of 16
In terms of child poverty under the age of 16, the demographic groups most similar to Immigrants from Africa are Immigrants from Micronesia (18.0%, a difference of 0.15%), Bermudan (18.0%, a difference of 0.18%), Nonimmigrants (17.9%, a difference of 0.25%), Osage (17.9%, a difference of 0.62%), and Immigrants from Cambodia (17.8%, a difference of 0.85%).
| Demographics | Rating | Rank | Child Poverty Under the Age of 16 |
| Immigrants | Panama | 4.1 /100 | #220 | Tragic 17.7% |
| Cubans | 3.7 /100 | #221 | Tragic 17.8% |
| Immigrants | Armenia | 3.6 /100 | #222 | Tragic 17.8% |
| Immigrants | Cambodia | 3.3 /100 | #223 | Tragic 17.8% |
| Osage | 3.1 /100 | #224 | Tragic 17.9% |
| Immigrants | Nonimmigrants | 2.7 /100 | #225 | Tragic 17.9% |
| Bermudans | 2.6 /100 | #226 | Tragic 18.0% |
| Immigrants | Africa | 2.5 /100 | #227 | Tragic 18.0% |
| Immigrants | Micronesia | 2.3 /100 | #228 | Tragic 18.0% |
| Marshallese | 1.8 /100 | #229 | Tragic 18.1% |
| Nepalese | 1.7 /100 | #230 | Tragic 18.2% |
| Nicaraguans | 1.7 /100 | #231 | Tragic 18.2% |
| Americans | 1.2 /100 | #232 | Tragic 18.3% |
| Fijians | 1.1 /100 | #233 | Tragic 18.4% |
| Immigrants | Nigeria | 1.0 /100 | #234 | Tragic 18.4% |
Demographics Similar to Uruguayans by Child Poverty Under the Age of 16
In terms of child poverty under the age of 16, the demographic groups most similar to Uruguayans are Immigrants from Colombia (16.1%, a difference of 0.040%), Hungarian (16.2%, a difference of 0.27%), Afghan (16.2%, a difference of 0.29%), Immigrants from Saudi Arabia (16.2%, a difference of 0.31%), and South American (16.0%, a difference of 0.40%).
| Demographics | Rating | Rank | Child Poverty Under the Age of 16 |
| Colombians | 67.6 /100 | #162 | Good 15.8% |
| Yugoslavians | 67.6 /100 | #163 | Good 15.8% |
| Immigrants | Germany | 67.3 /100 | #164 | Good 15.8% |
| Guamanians/Chamorros | 66.4 /100 | #165 | Good 15.9% |
| Immigrants | Oceania | 65.4 /100 | #166 | Good 15.9% |
| Costa Ricans | 61.1 /100 | #167 | Good 16.0% |
| South Americans | 57.9 /100 | #168 | Average 16.0% |
| Uruguayans | 54.7 /100 | #169 | Average 16.1% |
| Immigrants | Colombia | 54.4 /100 | #170 | Average 16.1% |
| Hungarians | 52.5 /100 | #171 | Average 16.2% |
| Afghans | 52.3 /100 | #172 | Average 16.2% |
| Immigrants | Saudi Arabia | 52.1 /100 | #173 | Average 16.2% |
| Whites/Caucasians | 50.0 /100 | #174 | Average 16.2% |
| Scotch-Irish | 47.1 /100 | #175 | Average 16.3% |
| Lebanese | 45.9 /100 | #176 | Average 16.3% |