Hopi vs Swiss Seniors Poverty Over the Age of 65
COMPARE
Hopi
Swiss
Seniors Poverty Over the Age of 65
Seniors Poverty Over the Age of 65 Comparison
Hopi
Swiss
17.8%
SENIORS POVERTY OVER THE AGE OF 65
0.0/ 100
METRIC RATING
340th/ 347
METRIC RANK
9.2%
SENIORS POVERTY OVER THE AGE OF 65
99.9/ 100
METRIC RATING
19th/ 347
METRIC RANK
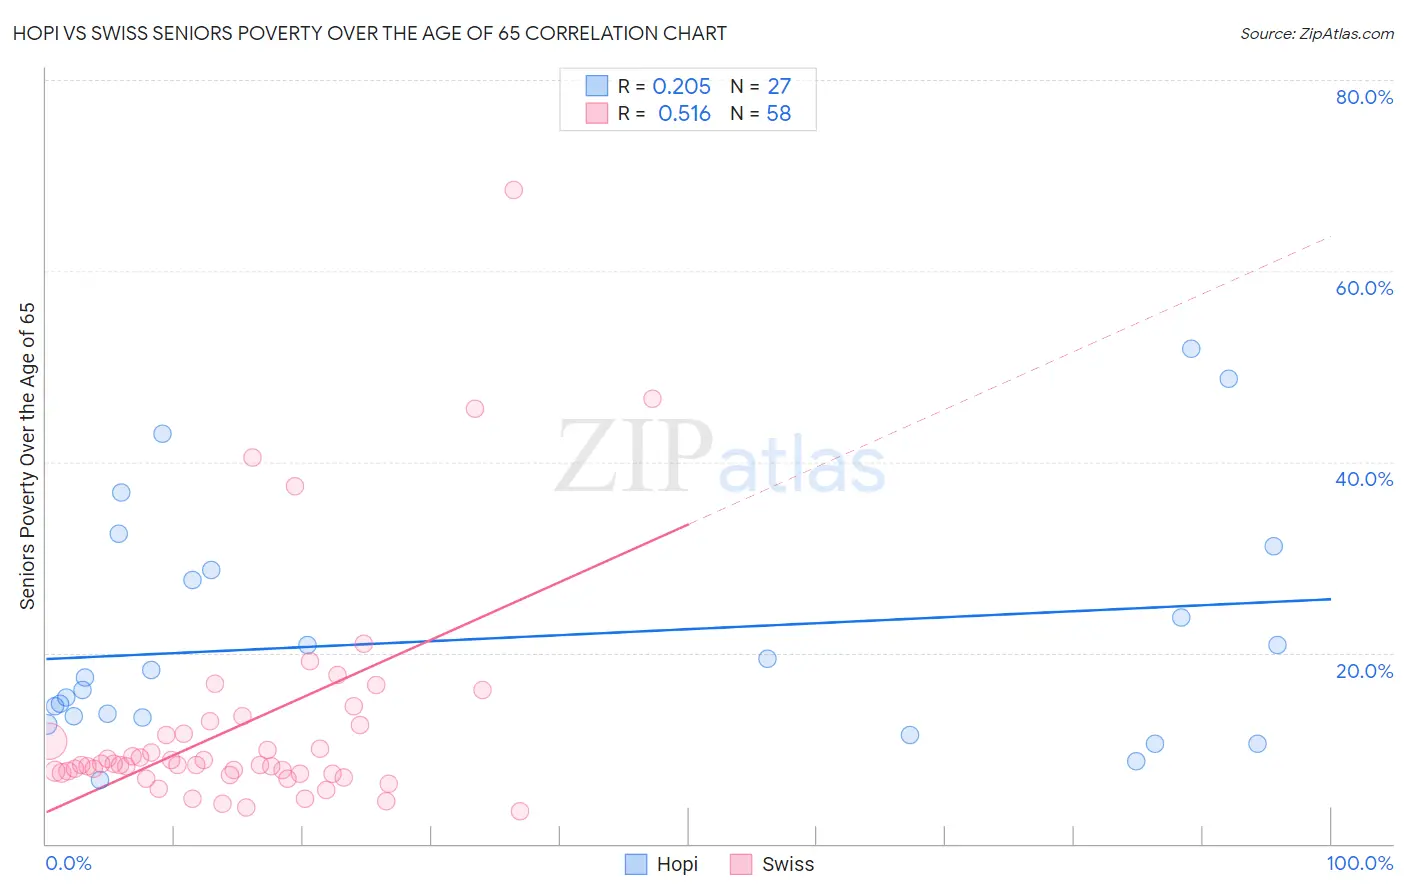
Hopi vs Swiss Seniors Poverty Over the Age of 65 Correlation Chart
The statistical analysis conducted on geographies consisting of 74,556,917 people shows a weak positive correlation between the proportion of Hopi and poverty level among seniors over the age of 65 in the United States with a correlation coefficient (R) of 0.205 and weighted average of 17.8%. Similarly, the statistical analysis conducted on geographies consisting of 462,823,104 people shows a substantial positive correlation between the proportion of Swiss and poverty level among seniors over the age of 65 in the United States with a correlation coefficient (R) of 0.516 and weighted average of 9.2%, a difference of 93.1%.
Seniors Poverty Over the Age of 65 Correlation Summary
| Measurement | Hopi | Swiss |
| Minimum | 6.7% | 3.4% |
| Maximum | 51.9% | 68.4% |
| Range | 45.2% | 65.1% |
| Mean | 21.6% | 12.6% |
| Median | 17.4% | 8.3% |
| Interquartile 25% (IQ1) | 13.3% | 7.4% |
| Interquartile 75% (IQ3) | 28.7% | 12.5% |
| Interquartile Range (IQR) | 15.4% | 5.1% |
| Standard Deviation (Sample) | 12.2% | 12.0% |
| Standard Deviation (Population) | 12.0% | 11.9% |
Similar Demographics by Seniors Poverty Over the Age of 65
Demographics Similar to Hopi by Seniors Poverty Over the Age of 65
In terms of seniors poverty over the age of 65, the demographic groups most similar to Hopi are Dominican (17.8%, a difference of 0.39%), Immigrants from Cuba (17.9%, a difference of 0.87%), Navajo (17.5%, a difference of 1.9%), Lumbee (18.1%, a difference of 2.0%), and Immigrants from Dominican Republic (18.3%, a difference of 2.9%).
| Demographics | Rating | Rank | Seniors Poverty Over the Age of 65 |
| Immigrants | Yemen | 0.0 /100 | #333 | Tragic 15.9% |
| Immigrants | Nicaragua | 0.0 /100 | #334 | Tragic 15.9% |
| Cubans | 0.0 /100 | #335 | Tragic 16.1% |
| Immigrants | Cabo Verde | 0.0 /100 | #336 | Tragic 16.2% |
| Immigrants | Caribbean | 0.0 /100 | #337 | Tragic 16.5% |
| Pueblo | 0.0 /100 | #338 | Tragic 17.2% |
| Navajo | 0.0 /100 | #339 | Tragic 17.5% |
| Hopi | 0.0 /100 | #340 | Tragic 17.8% |
| Dominicans | 0.0 /100 | #341 | Tragic 17.8% |
| Immigrants | Cuba | 0.0 /100 | #342 | Tragic 17.9% |
| Lumbee | 0.0 /100 | #343 | Tragic 18.1% |
| Immigrants | Dominican Republic | 0.0 /100 | #344 | Tragic 18.3% |
| Pima | 0.0 /100 | #345 | Tragic 19.8% |
| Tohono O'odham | 0.0 /100 | #346 | Tragic 20.8% |
| Puerto Ricans | 0.0 /100 | #347 | Tragic 21.4% |
Demographics Similar to Swiss by Seniors Poverty Over the Age of 65
In terms of seniors poverty over the age of 65, the demographic groups most similar to Swiss are Thai (9.2%, a difference of 0.14%), Slovak (9.2%, a difference of 0.29%), Scottish (9.2%, a difference of 0.32%), European (9.2%, a difference of 0.43%), and Luxembourger (9.2%, a difference of 0.43%).
| Demographics | Rating | Rank | Seniors Poverty Over the Age of 65 |
| Scandinavians | 99.9 /100 | #12 | Exceptional 9.1% |
| Croatians | 99.9 /100 | #13 | Exceptional 9.1% |
| Poles | 99.9 /100 | #14 | Exceptional 9.1% |
| Dutch | 99.9 /100 | #15 | Exceptional 9.1% |
| Europeans | 99.9 /100 | #16 | Exceptional 9.2% |
| Scottish | 99.9 /100 | #17 | Exceptional 9.2% |
| Slovaks | 99.9 /100 | #18 | Exceptional 9.2% |
| Swiss | 99.9 /100 | #19 | Exceptional 9.2% |
| Thais | 99.9 /100 | #20 | Exceptional 9.2% |
| Luxembourgers | 99.9 /100 | #21 | Exceptional 9.2% |
| Slovenes | 99.9 /100 | #22 | Exceptional 9.3% |
| Welsh | 99.9 /100 | #23 | Exceptional 9.3% |
| Bulgarians | 99.9 /100 | #24 | Exceptional 9.3% |
| Irish | 99.9 /100 | #25 | Exceptional 9.3% |
| Immigrants | Scotland | 99.9 /100 | #26 | Exceptional 9.3% |