Immigrants from Africa vs Swiss Seniors Poverty Over the Age of 65
COMPARE
Immigrants from Africa
Swiss
Seniors Poverty Over the Age of 65
Seniors Poverty Over the Age of 65 Comparison
Immigrants from Africa
Swiss
11.6%
SENIORS POVERTY OVER THE AGE OF 65
6.4/ 100
METRIC RATING
217th/ 347
METRIC RANK
9.2%
SENIORS POVERTY OVER THE AGE OF 65
99.9/ 100
METRIC RATING
19th/ 347
METRIC RANK
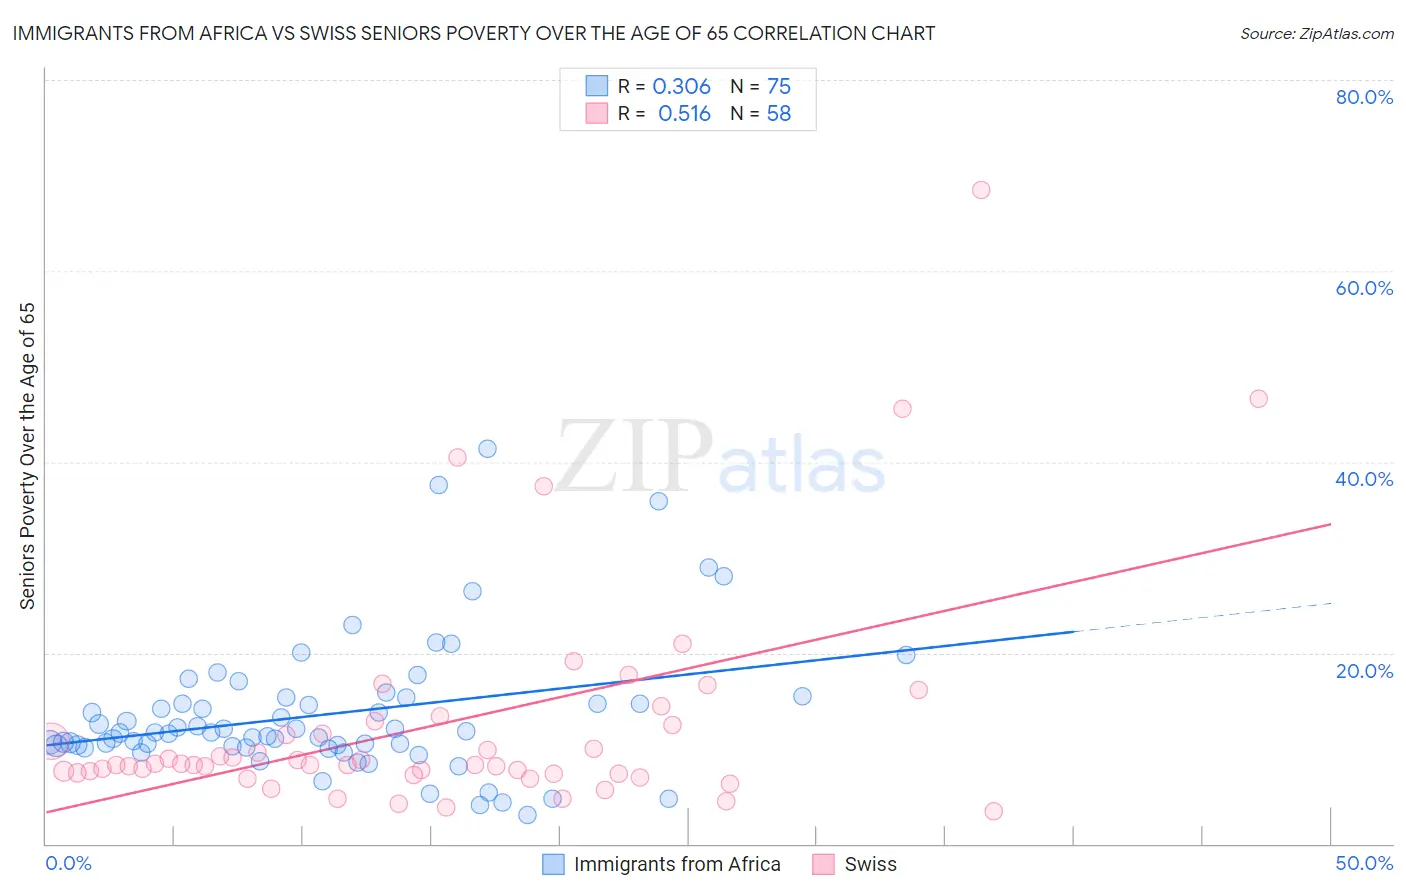
Immigrants from Africa vs Swiss Seniors Poverty Over the Age of 65 Correlation Chart
The statistical analysis conducted on geographies consisting of 466,905,238 people shows a mild positive correlation between the proportion of Immigrants from Africa and poverty level among seniors over the age of 65 in the United States with a correlation coefficient (R) of 0.306 and weighted average of 11.6%. Similarly, the statistical analysis conducted on geographies consisting of 462,823,104 people shows a substantial positive correlation between the proportion of Swiss and poverty level among seniors over the age of 65 in the United States with a correlation coefficient (R) of 0.516 and weighted average of 9.2%, a difference of 25.8%.
Seniors Poverty Over the Age of 65 Correlation Summary
| Measurement | Immigrants from Africa | Swiss |
| Minimum | 3.1% | 3.4% |
| Maximum | 41.4% | 68.4% |
| Range | 38.3% | 65.1% |
| Mean | 13.6% | 12.6% |
| Median | 11.7% | 8.3% |
| Interquartile 25% (IQ1) | 10.2% | 7.4% |
| Interquartile 75% (IQ3) | 15.3% | 12.5% |
| Interquartile Range (IQR) | 5.1% | 5.1% |
| Standard Deviation (Sample) | 7.2% | 12.0% |
| Standard Deviation (Population) | 7.1% | 11.9% |
Similar Demographics by Seniors Poverty Over the Age of 65
Demographics Similar to Immigrants from Africa by Seniors Poverty Over the Age of 65
In terms of seniors poverty over the age of 65, the demographic groups most similar to Immigrants from Africa are Immigrants from Morocco (11.6%, a difference of 0.15%), Immigrants from Ukraine (11.6%, a difference of 0.27%), Arapaho (11.6%, a difference of 0.45%), French American Indian (11.5%, a difference of 0.70%), and Immigrants from Russia (11.5%, a difference of 0.74%).
| Demographics | Rating | Rank | Seniors Poverty Over the Age of 65 |
| Ugandans | 11.2 /100 | #210 | Poor 11.4% |
| Indonesians | 10.4 /100 | #211 | Poor 11.5% |
| Immigrants | China | 9.5 /100 | #212 | Tragic 11.5% |
| Nepalese | 8.9 /100 | #213 | Tragic 11.5% |
| Immigrants | Russia | 8.8 /100 | #214 | Tragic 11.5% |
| French American Indians | 8.7 /100 | #215 | Tragic 11.5% |
| Immigrants | Morocco | 6.8 /100 | #216 | Tragic 11.6% |
| Immigrants | Africa | 6.4 /100 | #217 | Tragic 11.6% |
| Immigrants | Ukraine | 5.7 /100 | #218 | Tragic 11.6% |
| Arapaho | 5.2 /100 | #219 | Tragic 11.6% |
| Peruvians | 4.2 /100 | #220 | Tragic 11.7% |
| Argentineans | 4.1 /100 | #221 | Tragic 11.7% |
| Immigrants | Chile | 3.9 /100 | #222 | Tragic 11.7% |
| Immigrants | Congo | 3.8 /100 | #223 | Tragic 11.7% |
| Immigrants | Nigeria | 3.4 /100 | #224 | Tragic 11.7% |
Demographics Similar to Swiss by Seniors Poverty Over the Age of 65
In terms of seniors poverty over the age of 65, the demographic groups most similar to Swiss are Thai (9.2%, a difference of 0.14%), Slovak (9.2%, a difference of 0.29%), Scottish (9.2%, a difference of 0.32%), European (9.2%, a difference of 0.43%), and Luxembourger (9.2%, a difference of 0.43%).
| Demographics | Rating | Rank | Seniors Poverty Over the Age of 65 |
| Scandinavians | 99.9 /100 | #12 | Exceptional 9.1% |
| Croatians | 99.9 /100 | #13 | Exceptional 9.1% |
| Poles | 99.9 /100 | #14 | Exceptional 9.1% |
| Dutch | 99.9 /100 | #15 | Exceptional 9.1% |
| Europeans | 99.9 /100 | #16 | Exceptional 9.2% |
| Scottish | 99.9 /100 | #17 | Exceptional 9.2% |
| Slovaks | 99.9 /100 | #18 | Exceptional 9.2% |
| Swiss | 99.9 /100 | #19 | Exceptional 9.2% |
| Thais | 99.9 /100 | #20 | Exceptional 9.2% |
| Luxembourgers | 99.9 /100 | #21 | Exceptional 9.2% |
| Slovenes | 99.9 /100 | #22 | Exceptional 9.3% |
| Welsh | 99.9 /100 | #23 | Exceptional 9.3% |
| Bulgarians | 99.9 /100 | #24 | Exceptional 9.3% |
| Irish | 99.9 /100 | #25 | Exceptional 9.3% |
| Immigrants | Scotland | 99.9 /100 | #26 | Exceptional 9.3% |