Hopi vs Liberian Seniors Poverty Over the Age of 75
COMPARE
Hopi
Liberian
Seniors Poverty Over the Age of 75
Seniors Poverty Over the Age of 75 Comparison
Hopi
Liberians
18.9%
SENIORS POVERTY OVER THE AGE OF 75
0.0/ 100
METRIC RATING
339th/ 347
METRIC RANK
12.5%
SENIORS POVERTY OVER THE AGE OF 75
23.2/ 100
METRIC RATING
191st/ 347
METRIC RANK
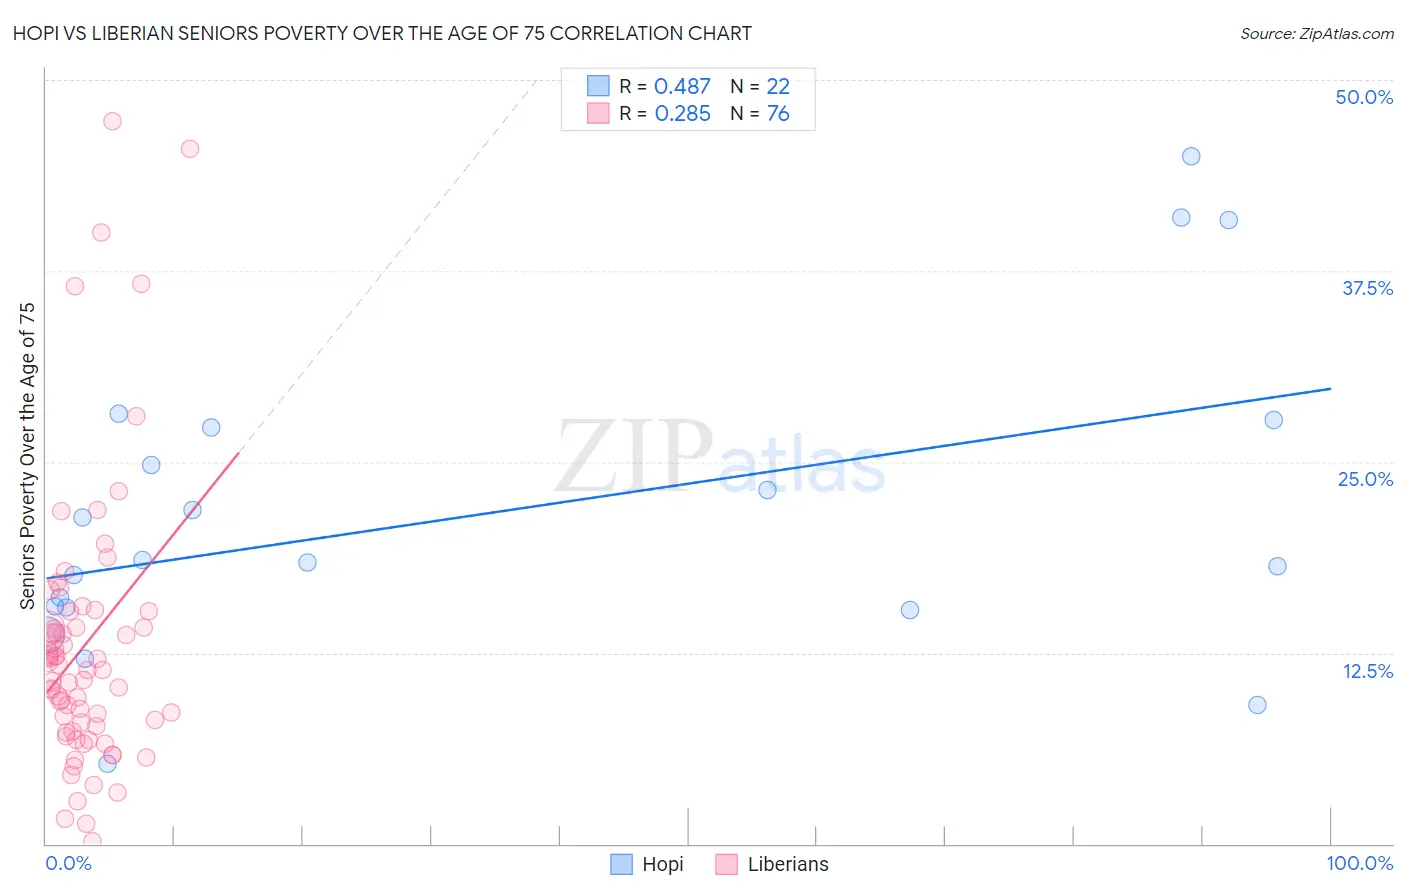
Hopi vs Liberian Seniors Poverty Over the Age of 75 Correlation Chart
The statistical analysis conducted on geographies consisting of 74,452,894 people shows a moderate positive correlation between the proportion of Hopi and poverty level among seniors over the age of 75 in the United States with a correlation coefficient (R) of 0.487 and weighted average of 18.9%. Similarly, the statistical analysis conducted on geographies consisting of 117,599,519 people shows a weak positive correlation between the proportion of Liberians and poverty level among seniors over the age of 75 in the United States with a correlation coefficient (R) of 0.285 and weighted average of 12.5%, a difference of 51.0%.
Seniors Poverty Over the Age of 75 Correlation Summary
| Measurement | Hopi | Liberian |
| Minimum | 5.3% | 0.12% |
| Maximum | 45.0% | 47.3% |
| Range | 39.7% | 47.2% |
| Mean | 21.7% | 13.0% |
| Median | 18.5% | 11.4% |
| Interquartile 25% (IQ1) | 15.4% | 7.5% |
| Interquartile 75% (IQ3) | 27.3% | 14.7% |
| Interquartile Range (IQR) | 11.8% | 7.2% |
| Standard Deviation (Sample) | 10.2% | 9.2% |
| Standard Deviation (Population) | 10.0% | 9.1% |
Similar Demographics by Seniors Poverty Over the Age of 75
Demographics Similar to Hopi by Seniors Poverty Over the Age of 75
In terms of seniors poverty over the age of 75, the demographic groups most similar to Hopi are Tohono O'odham (19.1%, a difference of 1.5%), Immigrants from Cabo Verde (18.5%, a difference of 2.0%), Navajo (19.4%, a difference of 2.8%), Yakama (18.3%, a difference of 2.9%), and Immigrants from Caribbean (18.2%, a difference of 3.4%).
| Demographics | Rating | Rank | Seniors Poverty Over the Age of 75 |
| Immigrants | St. Vincent and the Grenadines | 0.0 /100 | #332 | Tragic 17.5% |
| Immigrants | Nicaragua | 0.0 /100 | #333 | Tragic 17.6% |
| Immigrants | Grenada | 0.0 /100 | #334 | Tragic 17.8% |
| Cubans | 0.0 /100 | #335 | Tragic 18.0% |
| Immigrants | Caribbean | 0.0 /100 | #336 | Tragic 18.2% |
| Yakama | 0.0 /100 | #337 | Tragic 18.3% |
| Immigrants | Cabo Verde | 0.0 /100 | #338 | Tragic 18.5% |
| Hopi | 0.0 /100 | #339 | Tragic 18.9% |
| Tohono O'odham | 0.0 /100 | #340 | Tragic 19.1% |
| Navajo | 0.0 /100 | #341 | Tragic 19.4% |
| Dominicans | 0.0 /100 | #342 | Tragic 19.6% |
| Lumbee | 0.0 /100 | #343 | Tragic 19.7% |
| Immigrants | Cuba | 0.0 /100 | #344 | Tragic 19.9% |
| Immigrants | Dominican Republic | 0.0 /100 | #345 | Tragic 20.1% |
| Puerto Ricans | 0.0 /100 | #346 | Tragic 23.2% |
Demographics Similar to Liberians by Seniors Poverty Over the Age of 75
In terms of seniors poverty over the age of 75, the demographic groups most similar to Liberians are Immigrants from Congo (12.5%, a difference of 0.070%), Immigrants from Indonesia (12.5%, a difference of 0.13%), Immigrants from Northern Africa (12.5%, a difference of 0.22%), Yaqui (12.5%, a difference of 0.29%), and Choctaw (12.5%, a difference of 0.35%).
| Demographics | Rating | Rank | Seniors Poverty Over the Age of 75 |
| Kiowa | 36.0 /100 | #184 | Fair 12.3% |
| Immigrants | Malaysia | 35.8 /100 | #185 | Fair 12.3% |
| Sri Lankans | 32.3 /100 | #186 | Fair 12.4% |
| Yaqui | 25.9 /100 | #187 | Fair 12.5% |
| Immigrants | Northern Africa | 25.2 /100 | #188 | Fair 12.5% |
| Immigrants | Indonesia | 24.4 /100 | #189 | Fair 12.5% |
| Immigrants | Congo | 23.9 /100 | #190 | Fair 12.5% |
| Liberians | 23.2 /100 | #191 | Fair 12.5% |
| Choctaw | 20.2 /100 | #192 | Fair 12.5% |
| Taiwanese | 17.8 /100 | #193 | Poor 12.6% |
| Alsatians | 17.7 /100 | #194 | Poor 12.6% |
| Immigrants | France | 17.4 /100 | #195 | Poor 12.6% |
| Immigrants | Eastern Europe | 16.0 /100 | #196 | Poor 12.6% |
| Nepalese | 14.4 /100 | #197 | Poor 12.6% |
| Chileans | 13.7 /100 | #198 | Poor 12.6% |