Belizean vs Liberian Seniors Poverty Over the Age of 75
COMPARE
Belizean
Liberian
Seniors Poverty Over the Age of 75
Seniors Poverty Over the Age of 75 Comparison
Belizeans
Liberians
14.8%
SENIORS POVERTY OVER THE AGE OF 75
0.0/ 100
METRIC RATING
281st/ 347
METRIC RANK
12.5%
SENIORS POVERTY OVER THE AGE OF 75
23.2/ 100
METRIC RATING
191st/ 347
METRIC RANK
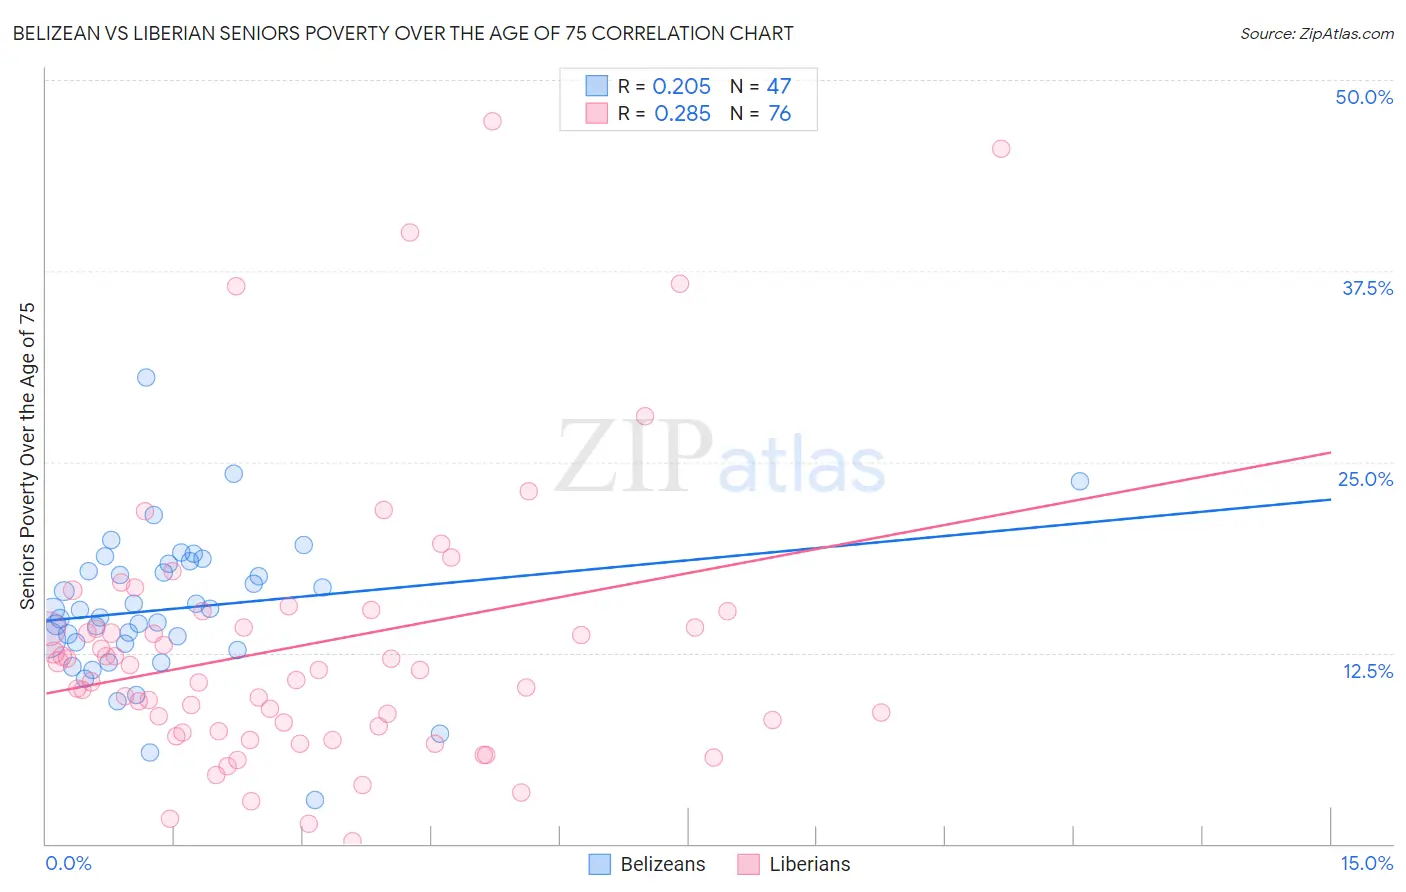
Belizean vs Liberian Seniors Poverty Over the Age of 75 Correlation Chart
The statistical analysis conducted on geographies consisting of 143,767,946 people shows a weak positive correlation between the proportion of Belizeans and poverty level among seniors over the age of 75 in the United States with a correlation coefficient (R) of 0.205 and weighted average of 14.8%. Similarly, the statistical analysis conducted on geographies consisting of 117,599,519 people shows a weak positive correlation between the proportion of Liberians and poverty level among seniors over the age of 75 in the United States with a correlation coefficient (R) of 0.285 and weighted average of 12.5%, a difference of 18.2%.
Seniors Poverty Over the Age of 75 Correlation Summary
| Measurement | Belizean | Liberian |
| Minimum | 2.8% | 0.12% |
| Maximum | 30.5% | 47.3% |
| Range | 27.7% | 47.2% |
| Mean | 15.4% | 13.0% |
| Median | 15.3% | 11.4% |
| Interquartile 25% (IQ1) | 13.1% | 7.5% |
| Interquartile 75% (IQ3) | 18.4% | 14.7% |
| Interquartile Range (IQR) | 5.2% | 7.2% |
| Standard Deviation (Sample) | 4.8% | 9.2% |
| Standard Deviation (Population) | 4.7% | 9.1% |
Similar Demographics by Seniors Poverty Over the Age of 75
Demographics Similar to Belizeans by Seniors Poverty Over the Age of 75
In terms of seniors poverty over the age of 75, the demographic groups most similar to Belizeans are Central American (14.7%, a difference of 0.12%), Immigrants from Senegal (14.8%, a difference of 0.18%), Guatemalan (14.8%, a difference of 0.24%), Black/African American (14.6%, a difference of 0.76%), and Cheyenne (14.9%, a difference of 0.88%).
| Demographics | Rating | Rank | Seniors Poverty Over the Age of 75 |
| Immigrants | Bahamas | 0.0 /100 | #274 | Tragic 14.4% |
| Immigrants | El Salvador | 0.0 /100 | #275 | Tragic 14.5% |
| Soviet Union | 0.0 /100 | #276 | Tragic 14.5% |
| Senegalese | 0.0 /100 | #277 | Tragic 14.5% |
| Immigrants | Colombia | 0.0 /100 | #278 | Tragic 14.6% |
| Blacks/African Americans | 0.0 /100 | #279 | Tragic 14.6% |
| Central Americans | 0.0 /100 | #280 | Tragic 14.7% |
| Belizeans | 0.0 /100 | #281 | Tragic 14.8% |
| Immigrants | Senegal | 0.0 /100 | #282 | Tragic 14.8% |
| Guatemalans | 0.0 /100 | #283 | Tragic 14.8% |
| Cheyenne | 0.0 /100 | #284 | Tragic 14.9% |
| Immigrants | Mexico | 0.0 /100 | #285 | Tragic 14.9% |
| Immigrants | Central America | 0.0 /100 | #286 | Tragic 15.0% |
| Immigrants | Guatemala | 0.0 /100 | #287 | Tragic 15.1% |
| Jamaicans | 0.0 /100 | #288 | Tragic 15.1% |
Demographics Similar to Liberians by Seniors Poverty Over the Age of 75
In terms of seniors poverty over the age of 75, the demographic groups most similar to Liberians are Immigrants from Congo (12.5%, a difference of 0.070%), Immigrants from Indonesia (12.5%, a difference of 0.13%), Immigrants from Northern Africa (12.5%, a difference of 0.22%), Yaqui (12.5%, a difference of 0.29%), and Choctaw (12.5%, a difference of 0.35%).
| Demographics | Rating | Rank | Seniors Poverty Over the Age of 75 |
| Kiowa | 36.0 /100 | #184 | Fair 12.3% |
| Immigrants | Malaysia | 35.8 /100 | #185 | Fair 12.3% |
| Sri Lankans | 32.3 /100 | #186 | Fair 12.4% |
| Yaqui | 25.9 /100 | #187 | Fair 12.5% |
| Immigrants | Northern Africa | 25.2 /100 | #188 | Fair 12.5% |
| Immigrants | Indonesia | 24.4 /100 | #189 | Fair 12.5% |
| Immigrants | Congo | 23.9 /100 | #190 | Fair 12.5% |
| Liberians | 23.2 /100 | #191 | Fair 12.5% |
| Choctaw | 20.2 /100 | #192 | Fair 12.5% |
| Taiwanese | 17.8 /100 | #193 | Poor 12.6% |
| Alsatians | 17.7 /100 | #194 | Poor 12.6% |
| Immigrants | France | 17.4 /100 | #195 | Poor 12.6% |
| Immigrants | Eastern Europe | 16.0 /100 | #196 | Poor 12.6% |
| Nepalese | 14.4 /100 | #197 | Poor 12.6% |
| Chileans | 13.7 /100 | #198 | Poor 12.6% |