Guyanese vs South American Indian Female Poverty Among 25-34 Year Olds
COMPARE
Guyanese
South American Indian
Female Poverty Among 25-34 Year Olds
Female Poverty Among 25-34 Year Olds Comparison
Guyanese
South American Indians
14.2%
FEMALE POVERTY AMONG 25-34 YEAR OLDS
8.6/ 100
METRIC RATING
209th/ 347
METRIC RANK
13.5%
FEMALE POVERTY AMONG 25-34 YEAR OLDS
51.9/ 100
METRIC RATING
171st/ 347
METRIC RANK
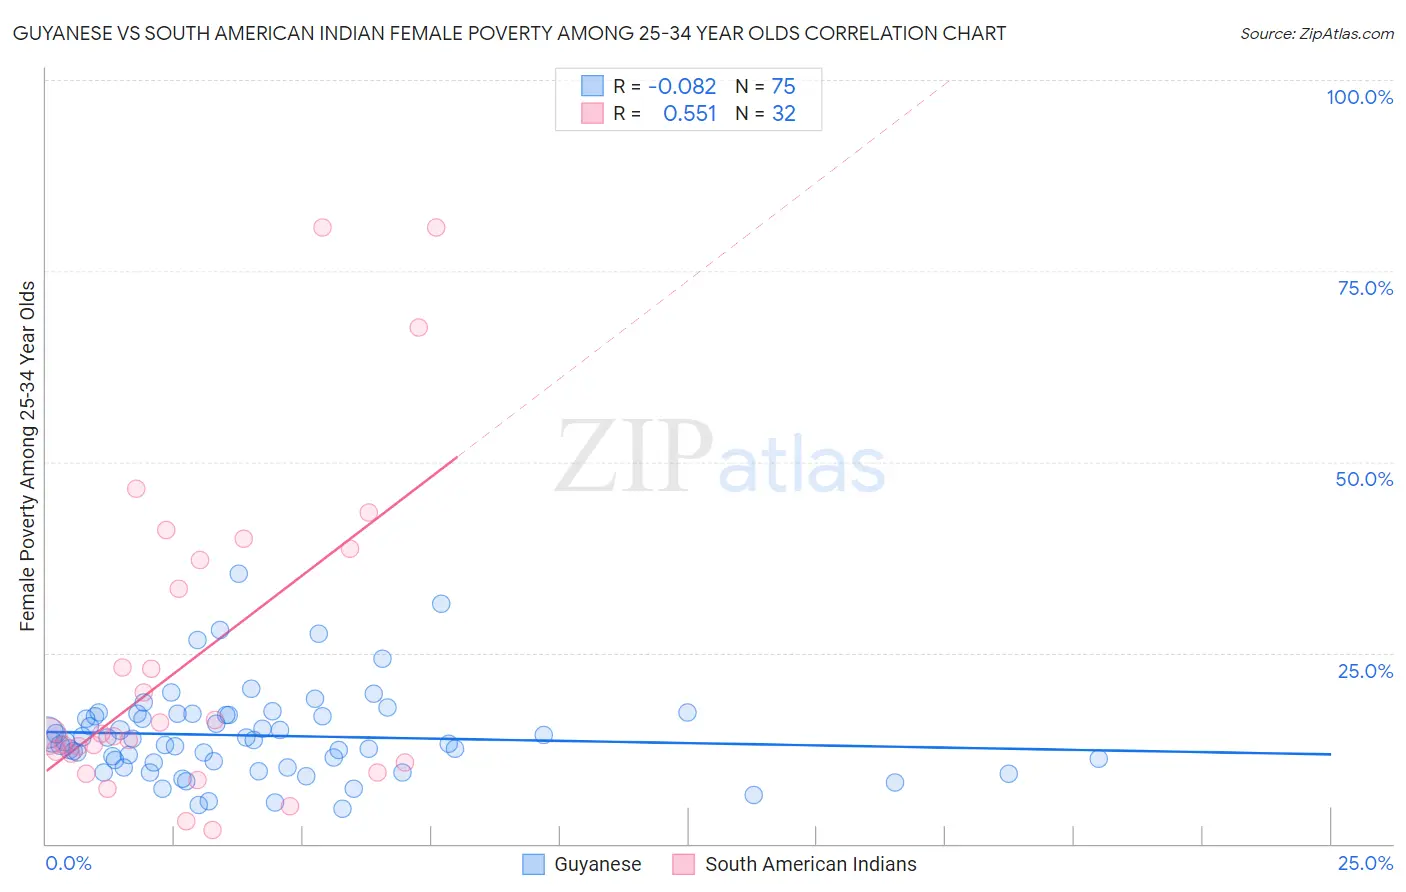
Guyanese vs South American Indian Female Poverty Among 25-34 Year Olds Correlation Chart
The statistical analysis conducted on geographies consisting of 175,220,528 people shows a slight negative correlation between the proportion of Guyanese and poverty level among females between the ages 25 and 34 in the United States with a correlation coefficient (R) of -0.082 and weighted average of 14.2%. Similarly, the statistical analysis conducted on geographies consisting of 163,669,571 people shows a substantial positive correlation between the proportion of South American Indians and poverty level among females between the ages 25 and 34 in the United States with a correlation coefficient (R) of 0.551 and weighted average of 13.5%, a difference of 5.1%.
Female Poverty Among 25-34 Year Olds Correlation Summary
| Measurement | Guyanese | South American Indian |
| Minimum | 4.6% | 1.7% |
| Maximum | 35.3% | 80.6% |
| Range | 30.7% | 78.9% |
| Mean | 14.2% | 24.4% |
| Median | 13.4% | 14.3% |
| Interquartile 25% (IQ1) | 10.7% | 11.2% |
| Interquartile 75% (IQ3) | 16.8% | 37.9% |
| Interquartile Range (IQR) | 6.2% | 26.6% |
| Standard Deviation (Sample) | 5.8% | 21.1% |
| Standard Deviation (Population) | 5.8% | 20.8% |
Similar Demographics by Female Poverty Among 25-34 Year Olds
Demographics Similar to Guyanese by Female Poverty Among 25-34 Year Olds
In terms of female poverty among 25-34 year olds, the demographic groups most similar to Guyanese are Panamanian (14.2%, a difference of 0.010%), Trinidadian and Tobagonian (14.2%, a difference of 0.12%), Immigrants from Guyana (14.3%, a difference of 0.57%), Puget Sound Salish (14.3%, a difference of 0.60%), and Immigrants from Panama (14.1%, a difference of 0.66%).
| Demographics | Rating | Rank | Female Poverty Among 25-34 Year Olds |
| Welsh | 17.2 /100 | #202 | Poor 14.0% |
| Immigrants | Immigrants | 14.5 /100 | #203 | Poor 14.0% |
| Hawaiians | 13.6 /100 | #204 | Poor 14.1% |
| Immigrants | Africa | 13.4 /100 | #205 | Poor 14.1% |
| Hungarians | 11.8 /100 | #206 | Poor 14.1% |
| Japanese | 11.7 /100 | #207 | Poor 14.1% |
| Immigrants | Panama | 11.6 /100 | #208 | Poor 14.1% |
| Guyanese | 8.6 /100 | #209 | Tragic 14.2% |
| Panamanians | 8.6 /100 | #210 | Tragic 14.2% |
| Trinidadians and Tobagonians | 8.2 /100 | #211 | Tragic 14.2% |
| Immigrants | Guyana | 6.6 /100 | #212 | Tragic 14.3% |
| Puget Sound Salish | 6.5 /100 | #213 | Tragic 14.3% |
| French | 6.2 /100 | #214 | Tragic 14.3% |
| Immigrants | Nigeria | 6.2 /100 | #215 | Tragic 14.3% |
| French Canadians | 5.5 /100 | #216 | Tragic 14.3% |
Demographics Similar to South American Indians by Female Poverty Among 25-34 Year Olds
In terms of female poverty among 25-34 year olds, the demographic groups most similar to South American Indians are Immigrants from Costa Rica (13.5%, a difference of 0.0%), Kenyan (13.5%, a difference of 0.010%), Immigrants from Uganda (13.5%, a difference of 0.090%), Immigrants from Oceania (13.5%, a difference of 0.16%), and Samoan (13.5%, a difference of 0.41%).
| Demographics | Rating | Rank | Female Poverty Among 25-34 Year Olds |
| Swiss | 61.7 /100 | #164 | Good 13.4% |
| Basques | 59.3 /100 | #165 | Average 13.4% |
| Belgians | 58.9 /100 | #166 | Average 13.4% |
| Immigrants | Bosnia and Herzegovina | 58.6 /100 | #167 | Average 13.4% |
| Immigrants | Afghanistan | 57.7 /100 | #168 | Average 13.4% |
| Samoans | 56.8 /100 | #169 | Average 13.5% |
| Immigrants | Uganda | 53.0 /100 | #170 | Average 13.5% |
| South American Indians | 51.9 /100 | #171 | Average 13.5% |
| Immigrants | Costa Rica | 51.9 /100 | #172 | Average 13.5% |
| Kenyans | 51.8 /100 | #173 | Average 13.5% |
| Immigrants | Oceania | 50.0 /100 | #174 | Average 13.5% |
| Bermudans | 46.8 /100 | #175 | Average 13.6% |
| Yugoslavians | 45.0 /100 | #176 | Average 13.6% |
| Venezuelans | 44.6 /100 | #177 | Average 13.6% |
| Canadians | 44.3 /100 | #178 | Average 13.6% |