German Russian vs Immigrants from Morocco Child Poverty Under the Age of 16
COMPARE
German Russian
Immigrants from Morocco
Child Poverty Under the Age of 16
Child Poverty Under the Age of 16 Comparison
German Russians
Immigrants from Morocco
17.4%
CHILD POVERTY UNDER THE AGE OF 16
8.6/ 100
METRIC RATING
207th/ 347
METRIC RANK
16.6%
CHILD POVERTY UNDER THE AGE OF 16
31.2/ 100
METRIC RATING
188th/ 347
METRIC RANK
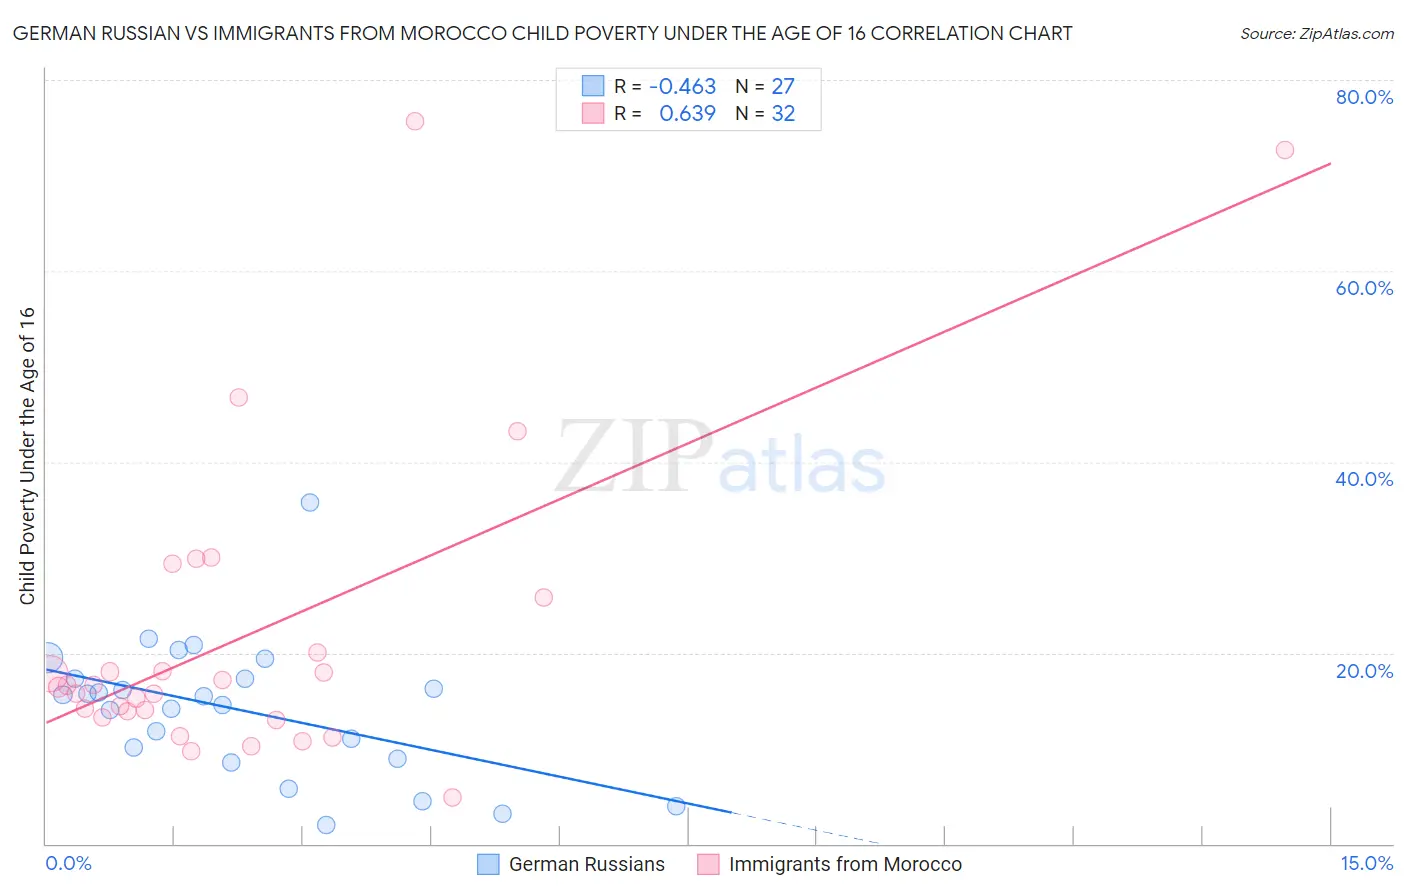
German Russian vs Immigrants from Morocco Child Poverty Under the Age of 16 Correlation Chart
The statistical analysis conducted on geographies consisting of 96,218,041 people shows a moderate negative correlation between the proportion of German Russians and poverty level among children under the age of 16 in the United States with a correlation coefficient (R) of -0.463 and weighted average of 17.4%. Similarly, the statistical analysis conducted on geographies consisting of 178,413,741 people shows a significant positive correlation between the proportion of Immigrants from Morocco and poverty level among children under the age of 16 in the United States with a correlation coefficient (R) of 0.639 and weighted average of 16.6%, a difference of 4.6%.
Child Poverty Under the Age of 16 Correlation Summary
| Measurement | German Russian | Immigrants from Morocco |
| Minimum | 2.0% | 4.9% |
| Maximum | 35.7% | 75.7% |
| Range | 33.7% | 70.8% |
| Mean | 14.0% | 21.8% |
| Median | 15.4% | 16.5% |
| Interquartile 25% (IQ1) | 8.9% | 13.5% |
| Interquartile 75% (IQ3) | 17.3% | 22.9% |
| Interquartile Range (IQR) | 8.4% | 9.4% |
| Standard Deviation (Sample) | 7.1% | 16.4% |
| Standard Deviation (Population) | 7.0% | 16.2% |
Demographics Similar to German Russians and Immigrants from Morocco by Child Poverty Under the Age of 16
In terms of child poverty under the age of 16, the demographic groups most similar to German Russians are Alaska Native (17.2%, a difference of 1.0%), Aleut (17.1%, a difference of 1.5%), Hmong (17.1%, a difference of 1.6%), Immigrants from Sierra Leone (17.1%, a difference of 1.6%), and Ugandan (17.1%, a difference of 1.6%). Similarly, the demographic groups most similar to Immigrants from Morocco are Arab (16.6%, a difference of 0.020%), Immigrants from Portugal (16.6%, a difference of 0.17%), Immigrants from Costa Rica (16.6%, a difference of 0.22%), Immigrants from Iraq (16.7%, a difference of 0.42%), and Spanish (16.7%, a difference of 0.99%).
| Demographics | Rating | Rank | Child Poverty Under the Age of 16 |
| Arabs | 31.4 /100 | #187 | Fair 16.6% |
| Immigrants | Morocco | 31.2 /100 | #188 | Fair 16.6% |
| Immigrants | Portugal | 30.0 /100 | #189 | Fair 16.6% |
| Immigrants | Costa Rica | 29.6 /100 | #190 | Fair 16.6% |
| Immigrants | Iraq | 28.3 /100 | #191 | Fair 16.7% |
| Spanish | 24.5 /100 | #192 | Fair 16.7% |
| Spaniards | 23.2 /100 | #193 | Fair 16.8% |
| Immigrants | Uruguay | 23.1 /100 | #194 | Fair 16.8% |
| Immigrants | Uganda | 22.5 /100 | #195 | Fair 16.8% |
| Immigrants | Lebanon | 22.0 /100 | #196 | Fair 16.8% |
| Immigrants | Kenya | 19.1 /100 | #197 | Poor 16.9% |
| Delaware | 17.1 /100 | #198 | Poor 17.0% |
| Immigrants | Afghanistan | 15.1 /100 | #199 | Poor 17.0% |
| Immigrants | Cameroon | 14.7 /100 | #200 | Poor 17.1% |
| Immigrants | Uzbekistan | 14.7 /100 | #201 | Poor 17.1% |
| Ugandans | 14.3 /100 | #202 | Poor 17.1% |
| Immigrants | Sierra Leone | 14.2 /100 | #203 | Poor 17.1% |
| Hmong | 14.0 /100 | #204 | Poor 17.1% |
| Aleuts | 13.9 /100 | #205 | Poor 17.1% |
| Alaska Natives | 11.8 /100 | #206 | Poor 17.2% |
| German Russians | 8.6 /100 | #207 | Tragic 17.4% |