German Russian vs Czech Seniors Poverty Over the Age of 65
COMPARE
German Russian
Czech
Seniors Poverty Over the Age of 65
Seniors Poverty Over the Age of 65 Comparison
German Russians
Czechs
11.0%
SENIORS POVERTY OVER THE AGE OF 65
46.9/ 100
METRIC RATING
178th/ 347
METRIC RANK
9.0%
SENIORS POVERTY OVER THE AGE OF 65
100.0/ 100
METRIC RATING
8th/ 347
METRIC RANK
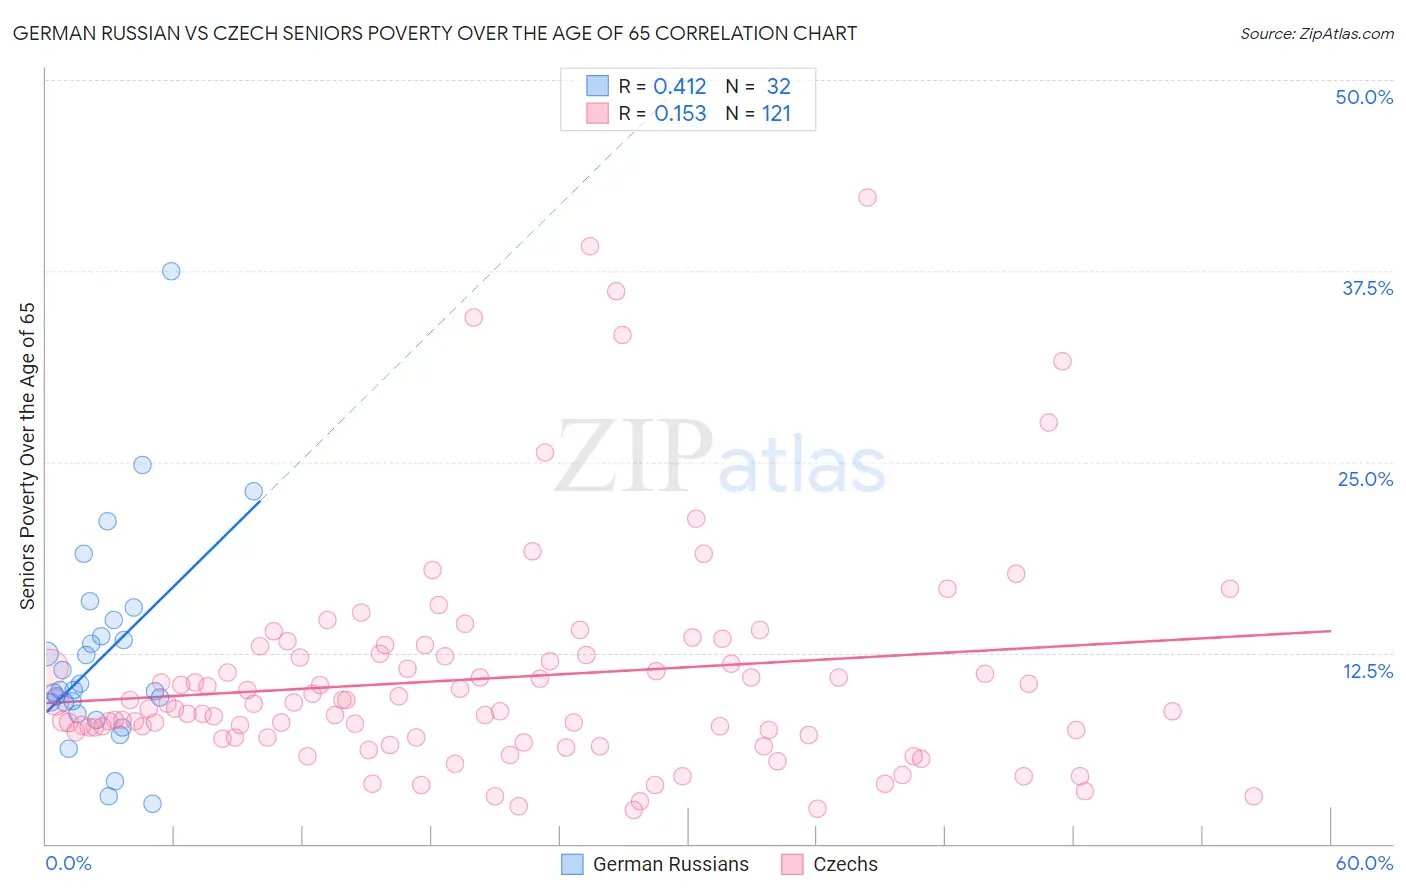
German Russian vs Czech Seniors Poverty Over the Age of 65 Correlation Chart
The statistical analysis conducted on geographies consisting of 96,327,795 people shows a moderate positive correlation between the proportion of German Russians and poverty level among seniors over the age of 65 in the United States with a correlation coefficient (R) of 0.412 and weighted average of 11.0%. Similarly, the statistical analysis conducted on geographies consisting of 482,004,633 people shows a poor positive correlation between the proportion of Czechs and poverty level among seniors over the age of 65 in the United States with a correlation coefficient (R) of 0.153 and weighted average of 9.0%, a difference of 21.9%.
Seniors Poverty Over the Age of 65 Correlation Summary
| Measurement | German Russian | Czech |
| Minimum | 2.6% | 2.2% |
| Maximum | 37.5% | 42.3% |
| Range | 34.9% | 40.1% |
| Mean | 12.3% | 10.8% |
| Median | 10.1% | 8.9% |
| Interquartile 25% (IQ1) | 8.9% | 7.0% |
| Interquartile 75% (IQ3) | 14.1% | 12.3% |
| Interquartile Range (IQR) | 5.2% | 5.4% |
| Standard Deviation (Sample) | 6.9% | 7.3% |
| Standard Deviation (Population) | 6.8% | 7.3% |
Similar Demographics by Seniors Poverty Over the Age of 65
Demographics Similar to German Russians by Seniors Poverty Over the Age of 65
In terms of seniors poverty over the age of 65, the demographic groups most similar to German Russians are Cherokee (11.0%, a difference of 0.040%), Immigrants from Malaysia (11.0%, a difference of 0.090%), Immigrants from Northern Africa (11.0%, a difference of 0.21%), Creek (10.9%, a difference of 0.24%), and Immigrants from Sudan (10.9%, a difference of 0.28%).
| Demographics | Rating | Rank | Seniors Poverty Over the Age of 65 |
| Immigrants | Nonimmigrants | 55.1 /100 | #171 | Average 10.9% |
| Immigrants | Syria | 54.7 /100 | #172 | Average 10.9% |
| Spaniards | 50.7 /100 | #173 | Average 10.9% |
| Immigrants | Sudan | 50.0 /100 | #174 | Average 10.9% |
| Creek | 49.6 /100 | #175 | Average 10.9% |
| Immigrants | Malaysia | 47.9 /100 | #176 | Average 11.0% |
| Cherokee | 47.3 /100 | #177 | Average 11.0% |
| German Russians | 46.9 /100 | #178 | Average 11.0% |
| Immigrants | Northern Africa | 44.6 /100 | #179 | Average 11.0% |
| Immigrants | Thailand | 43.5 /100 | #180 | Average 11.0% |
| Immigrants | Eastern Africa | 43.4 /100 | #181 | Average 11.0% |
| Immigrants | Fiji | 42.0 /100 | #182 | Average 11.0% |
| Immigrants | Kazakhstan | 41.0 /100 | #183 | Average 11.0% |
| Immigrants | France | 40.9 /100 | #184 | Average 11.0% |
| Immigrants | Lebanon | 38.2 /100 | #185 | Fair 11.1% |
Demographics Similar to Czechs by Seniors Poverty Over the Age of 65
In terms of seniors poverty over the age of 65, the demographic groups most similar to Czechs are German (9.0%, a difference of 0.53%), English (9.1%, a difference of 0.67%), Lithuanian (9.1%, a difference of 0.77%), Maltese (9.1%, a difference of 1.2%), and Scandinavian (9.1%, a difference of 1.4%).
| Demographics | Rating | Rank | Seniors Poverty Over the Age of 65 |
| Chinese | 100.0 /100 | #1 | Exceptional 8.3% |
| Tlingit-Haida | 100.0 /100 | #2 | Exceptional 8.3% |
| Norwegians | 100.0 /100 | #3 | Exceptional 8.7% |
| Swedes | 100.0 /100 | #4 | Exceptional 8.7% |
| Immigrants | India | 100.0 /100 | #5 | Exceptional 8.8% |
| Danes | 100.0 /100 | #6 | Exceptional 8.8% |
| Germans | 100.0 /100 | #7 | Exceptional 9.0% |
| Czechs | 100.0 /100 | #8 | Exceptional 9.0% |
| English | 100.0 /100 | #9 | Exceptional 9.1% |
| Lithuanians | 100.0 /100 | #10 | Exceptional 9.1% |
| Maltese | 99.9 /100 | #11 | Exceptional 9.1% |
| Scandinavians | 99.9 /100 | #12 | Exceptional 9.1% |
| Croatians | 99.9 /100 | #13 | Exceptional 9.1% |
| Poles | 99.9 /100 | #14 | Exceptional 9.1% |
| Dutch | 99.9 /100 | #15 | Exceptional 9.1% |